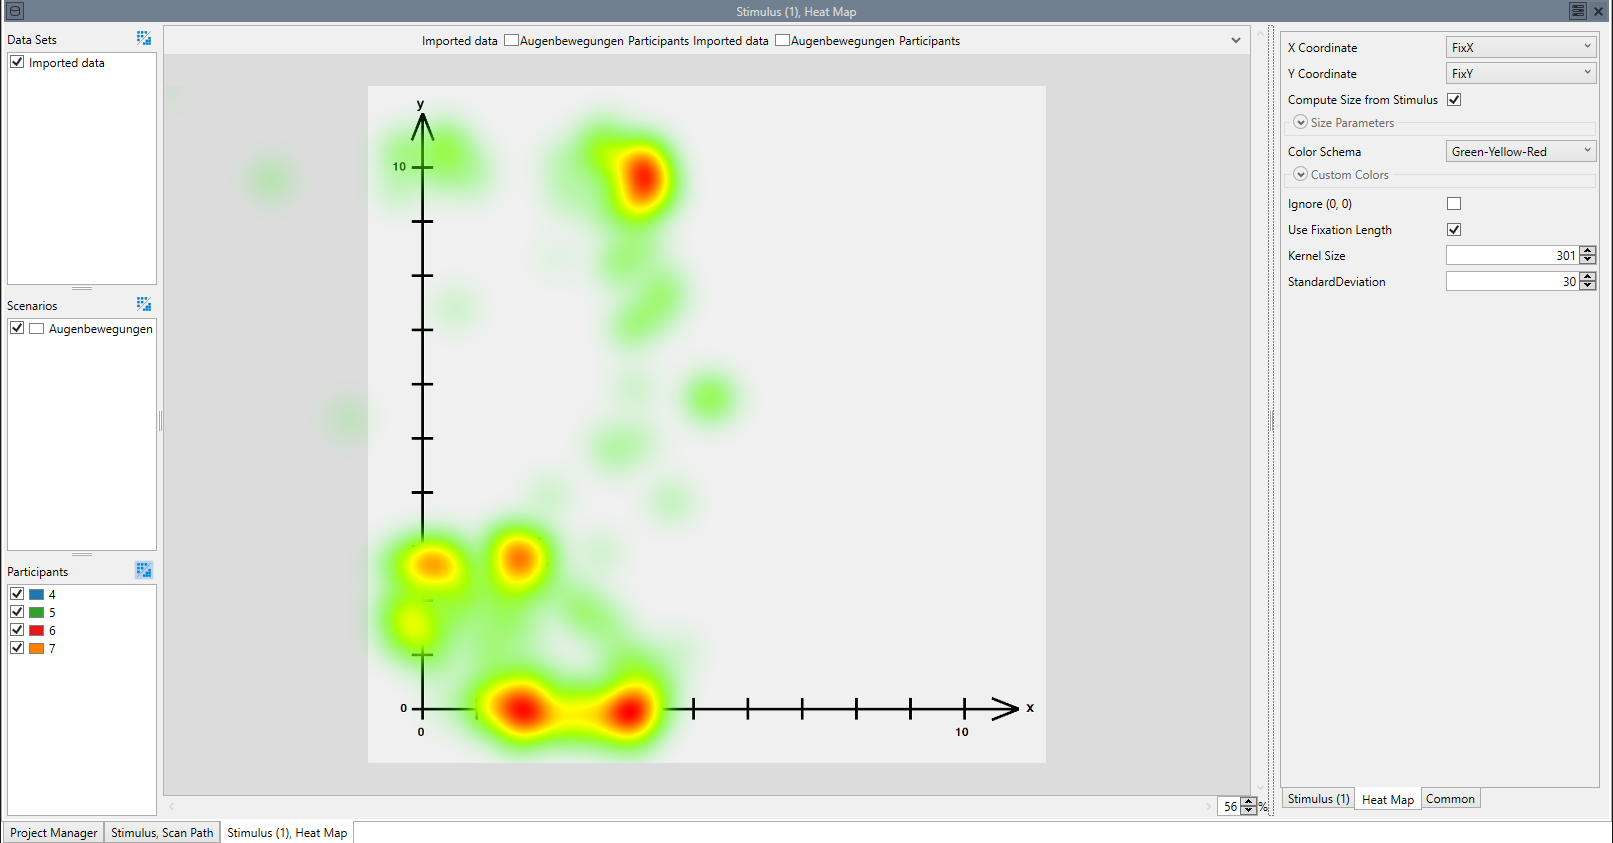
Heat Map
The heat map visualizes the distribution of fixations, where the intensity and density of fixations are coded into colors.
Aggregation
The heat map visualization is able to aggregate. When aggregating, the displayed heat map shows a heat map over all selected participants and/or scenarios / data sets. Note that aggregation for the scan path is only enabled, when the underlying stimulus visualization is able to aggregate. Figure 2 shows a heat map of the same data as shown in figure 1, but with aggregated participants.
Settings
- X Coordinate:
- The column containing the x coordinate of the fixations from which the heat map is computed.
- Y Coordinate:
- The column containing the y coordinate of the fixations from which the heat map is computed.
- Size Parameters:
Parameters that determine the size of the heat map:
- Clamp to Stimulus:
- If enabled, the size of the heat map depends on the size of the stimulus and coordinates outside of the visible area are ignored. If disabled, the heat maps is as large as necessary to display all coordinates in the data.
- Margin:
- A margin on which the heat map can be displayed outside of the stimulus, if Clamp to Stimulus is enabled. The margin is given as a percentage of the stimulus size.
- Scale (X):
- Multiply the values found in the "X Coordinate" column by this value.
- Scale (Y):
- Multiply the values found in the "Y Coordinate" column by this value.
- Offset (X):
- Offset the result of the scaled X coordinate by this value.
- Offset (Y):
- Offset the result of the scaled Y coordinate by this value.
As an example, assume the coordinates of your fixations are between -1 and 1, indicating a normalized coordinate system centered on the stimulus, and your stimulus has a size of 800 x 600. To convert between those coordinate systems, the formula Coordinate * Scale + Offset is applied. So, in the example, set "Scale (X)" to 400 and "Scale (Y)" to 300. The resulting coordinates will thus be between -400 and 400 (-300 and 300). Set Offset (X) to 400 and Offset (Y) to 300, to move the coordinates into a system that fits the heatmap.
- Compute Scale :
- This factor can be used to downscale the heatmap for the computation, if the computation of the heatmap is too slow. A smaller heatmap (scaled by the given factor from the original size) is used, and the result is upscaled to the original size for displaying. Accordingly, the smaller the Compute Scale, the faster the heatmap is computed, but the less accurate it is.
- Color Schema:
- The Color Schema that is used for this Heatmap.
- Custom Colors:
- The Colors for the "Custom" Color Schema. The drawn heatmap interpolates between all colors selected here.
- Ignore (0, 0):
- If true, ignores all (0, 0) coordinates when computing the heatmap. Use this, if the data defaults to (0, 0) on undetected eye direction.
- Use Fixation Length:
- When basing the heatmap upon fixations, use the length of a fixation as a weight.
- Kernel Size:
- The size of the Gaussian kernel used to create the heatmap.
- StandardDeviation:
- The standard deviation of the Gaussian kernel used to create the heatmap.

