Dashboard Windows
Table of Contents
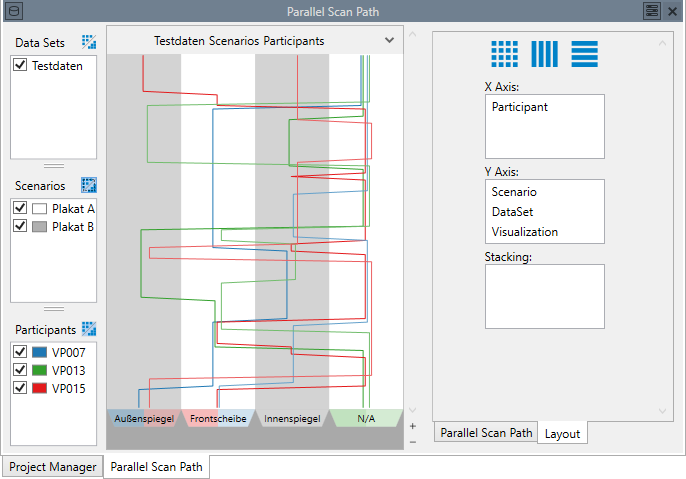
A dashboard window contains information about analyses and visualizations. A dashboard window normally displays one visualization or analysis, but it is possible to coalesce several visualizations or analyses in a single dashboard window (See Workflow Explorer Context Menu). This is especially useful for visualizations, as it allows linking their visual representation, e.g. their cursors. Figure 1 shows a breakdown of the different areas of a dashboard window.
The leftmost part displays the input selection. The middle of the dashboard window is reserved for visualization windows. To the right the settings are displayed. The settings consist of a distinct tab for each visualization or analysis that is displayed in the dashboard window, plus a "Common" tab that is common to all visualizations. The input selection and the settings can be shown and hidden via buttons in the header of the dashboard window, in order to free visual space for the visualization windows. The close button in the header of the the dashboard window will close the dashboard window. The window can then be re-opened by clicking on the appropriate node in the workflow explorer. Thus, this close button is distinct from the delete button on the node in the workflow explorer, which deletes the entire node.
Input Selection
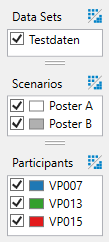
Figure 2 shows the data input selection of a dashboard window. Here you can select which data sets, scenarios and participants should be visualized, or be used as an input for an analysis. Additionally, the three buttons  allow to select aggregation for data sets, scenarios and participants.
Aggregation treats the elements of the aggregated category as a single element. If you aggregate the scenarios of a heatmap visualization, you will get a heatmap for each participant, showing the gazes over all scenarios for that participant. If you aggregate the participants, you will get a heatmap for each scenario, showing the gazes all participants during that scenario. If you aggregate both scenarios and participants, you will get a single heatmap displaying the entire data set.
Aggregation is not possible for all visualizations and analyses. The documentation of each visualization and analysis will give a detailed description of the concrete effect of aggregation.
The context menu of the Input Selection (and the menu hidden behind the arrow next to the aggregation button) has some options for selecting and deselecting elements quicker than by selecting each data set/scenario/participant manually:
- Check All:
- Check all data sets/scenarios/participants, regardless of which are currently selected.
- Check All Selected:
- Check all data sets/scenarios/participants that are currently selected, in addition to those that are already selected.
- Uncheck All Selected:
- Uncheck all data sets/scenario/participants that are currently selected.
- Check Only Selected:
- Check all data sets/scenarios/participants that are currently selected, uncheck all those that are not selected.
- Invert Checked/Unchecked:
- Check all data sets/scenarios/participants that are currently unchecked, uncheck all those that are currently checked.
Visualization Windows
The visualization windows are the central part of each dashboard window. Here, the visualizations, or the previews of analyses, are displayed. If no aggregation is active, data sets x scenarios x data sets visualization window are shown. The top of each visualization window shows which data set/scenario/participant is visualized in the window.
Common
The common tab contains some common settings that are applied to all Visualizations. Additionally, it allows influencing how the visualization windows are laid out in the central area. Note that any change on the layout settings here will immediately override any manual layout created by dragging and dropping visualization windows.
Each common setting is only active if at least one visualization shown in the window supports it. Refer to common settings of time-based visualizations for a detailed description of the common settings that apply to time-based visualizations.
Layout
The Layout part of the common settings tabs allows influencing how the visualization windows are laid out.
- Layout Wizard
- The first of the buttons on top allows enabling the Layout Wizard, which tries to create a fitting layout for the selected visualizations. In most cases, leaving the Layout Wizard enabled is the best solution for handling multiple visualizations in the same window.
- Mixed Layout Primacy
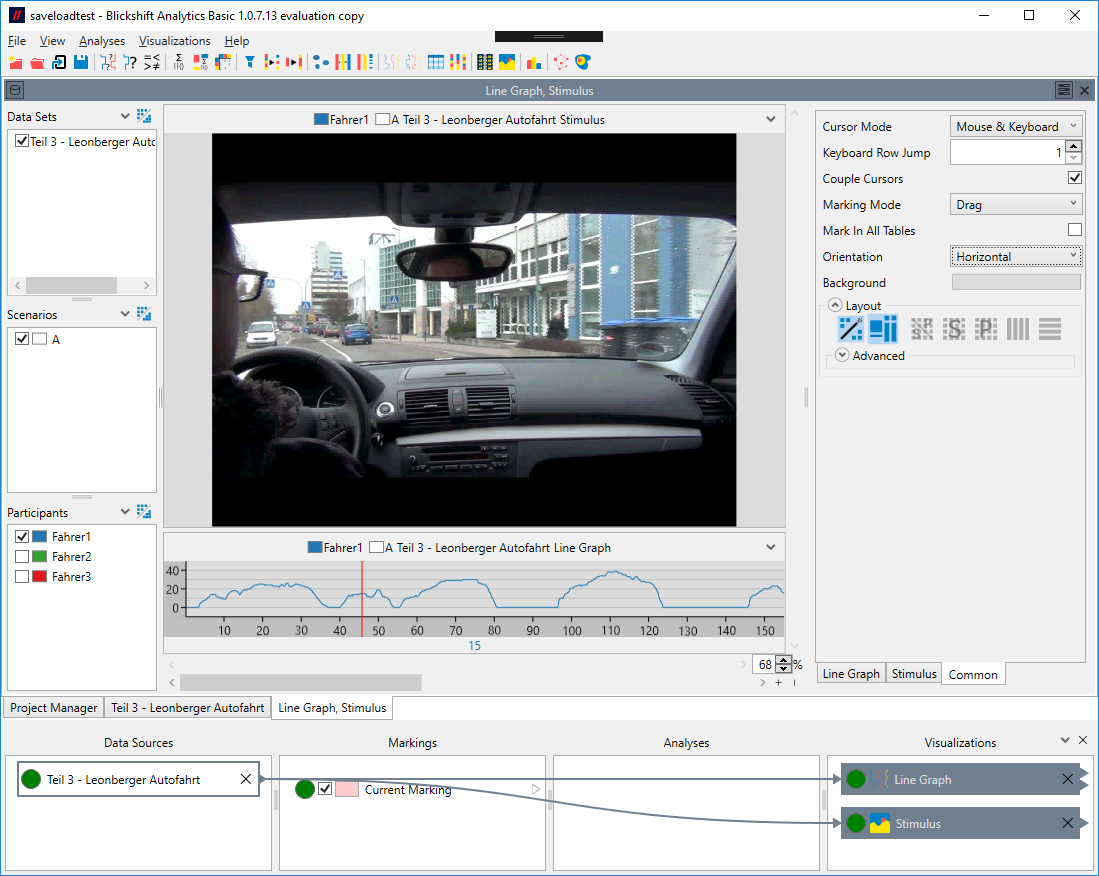
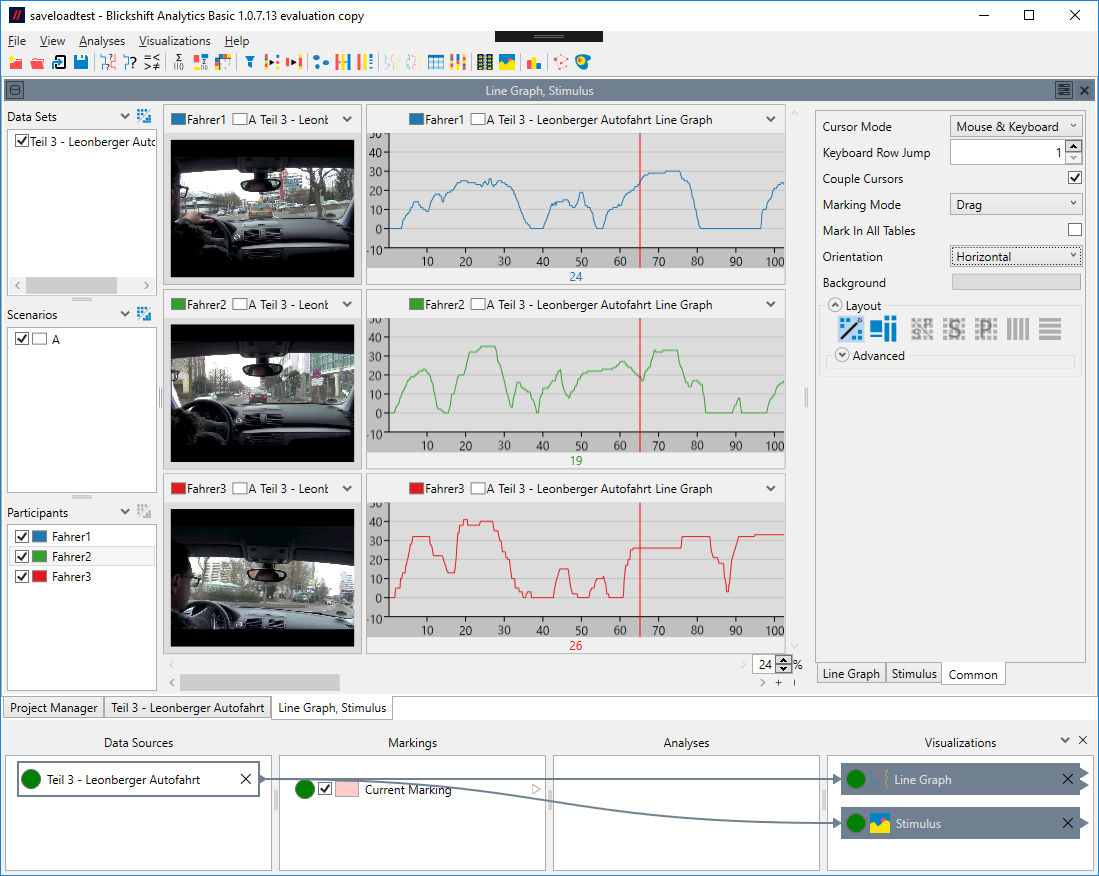
- The mixed layout primacy influences how a layout wizard operates on windows that contain both time-based visualizations and other visualizations like a scan path. Figure 3 shows a layout where the stimulus visualization has primacy over the line graph. In figure 4 the line graph has primacy over the stimulus visualization.
Figure 3: Mixed Layout primacy enabled: Primacy is given to the stimulus, the line graph works as an addition (horizontal mode).
Figure 4: Mixed layout primacy disabled: Primacy is given to the line graphs, with stimuli displayed as an addition.
In specific circumstances it might be desired to more directly control the layout. Therefore it is possible to manually create a fitting layout. This layout can be set via five preselection buttons and an advance layout area. Both are only active if the Layout Wizard is disabled.
The five remaining buttons at the top provide five often used preselections for the layout:
- Scenario-Participant Grid
- The scenario-participant grid layout will show participants next to each other in the horizontal direction, and everything else in the vertical direction.
- Scenario Grid
- The scenario grid layout shows scenarios in both horizontal and vertical direction and is meant for stimulus-based visualizations like heat maps in cases with many scenarios but few participants.
- Participant Grid
- The participant grid layout shows participants in both horizontal and vertical direction and is meant for stimulus-based visualizations like heat maps in cases with few scenarios but many participants.
- Horizontal
- The horizontal layout will show all visualization windows next to each other in the horizontal direction.
- Vertical
- The vertical layout will show all visualization windows next to each other in the vertical direction.
Note that the horizontal layout best fits vertically oriented visualizations (see "orientation of time-based visualizations") and vice versa.
Advanced Layout
The Advanced Layout settings allow fine tuning of the layout and need to be explained in further detail. All five preselections can also be created via the advanced settings. In fact when clicking one of the buttons, the effect can be seen immediately in the advanced settings.
Manual Layout Control
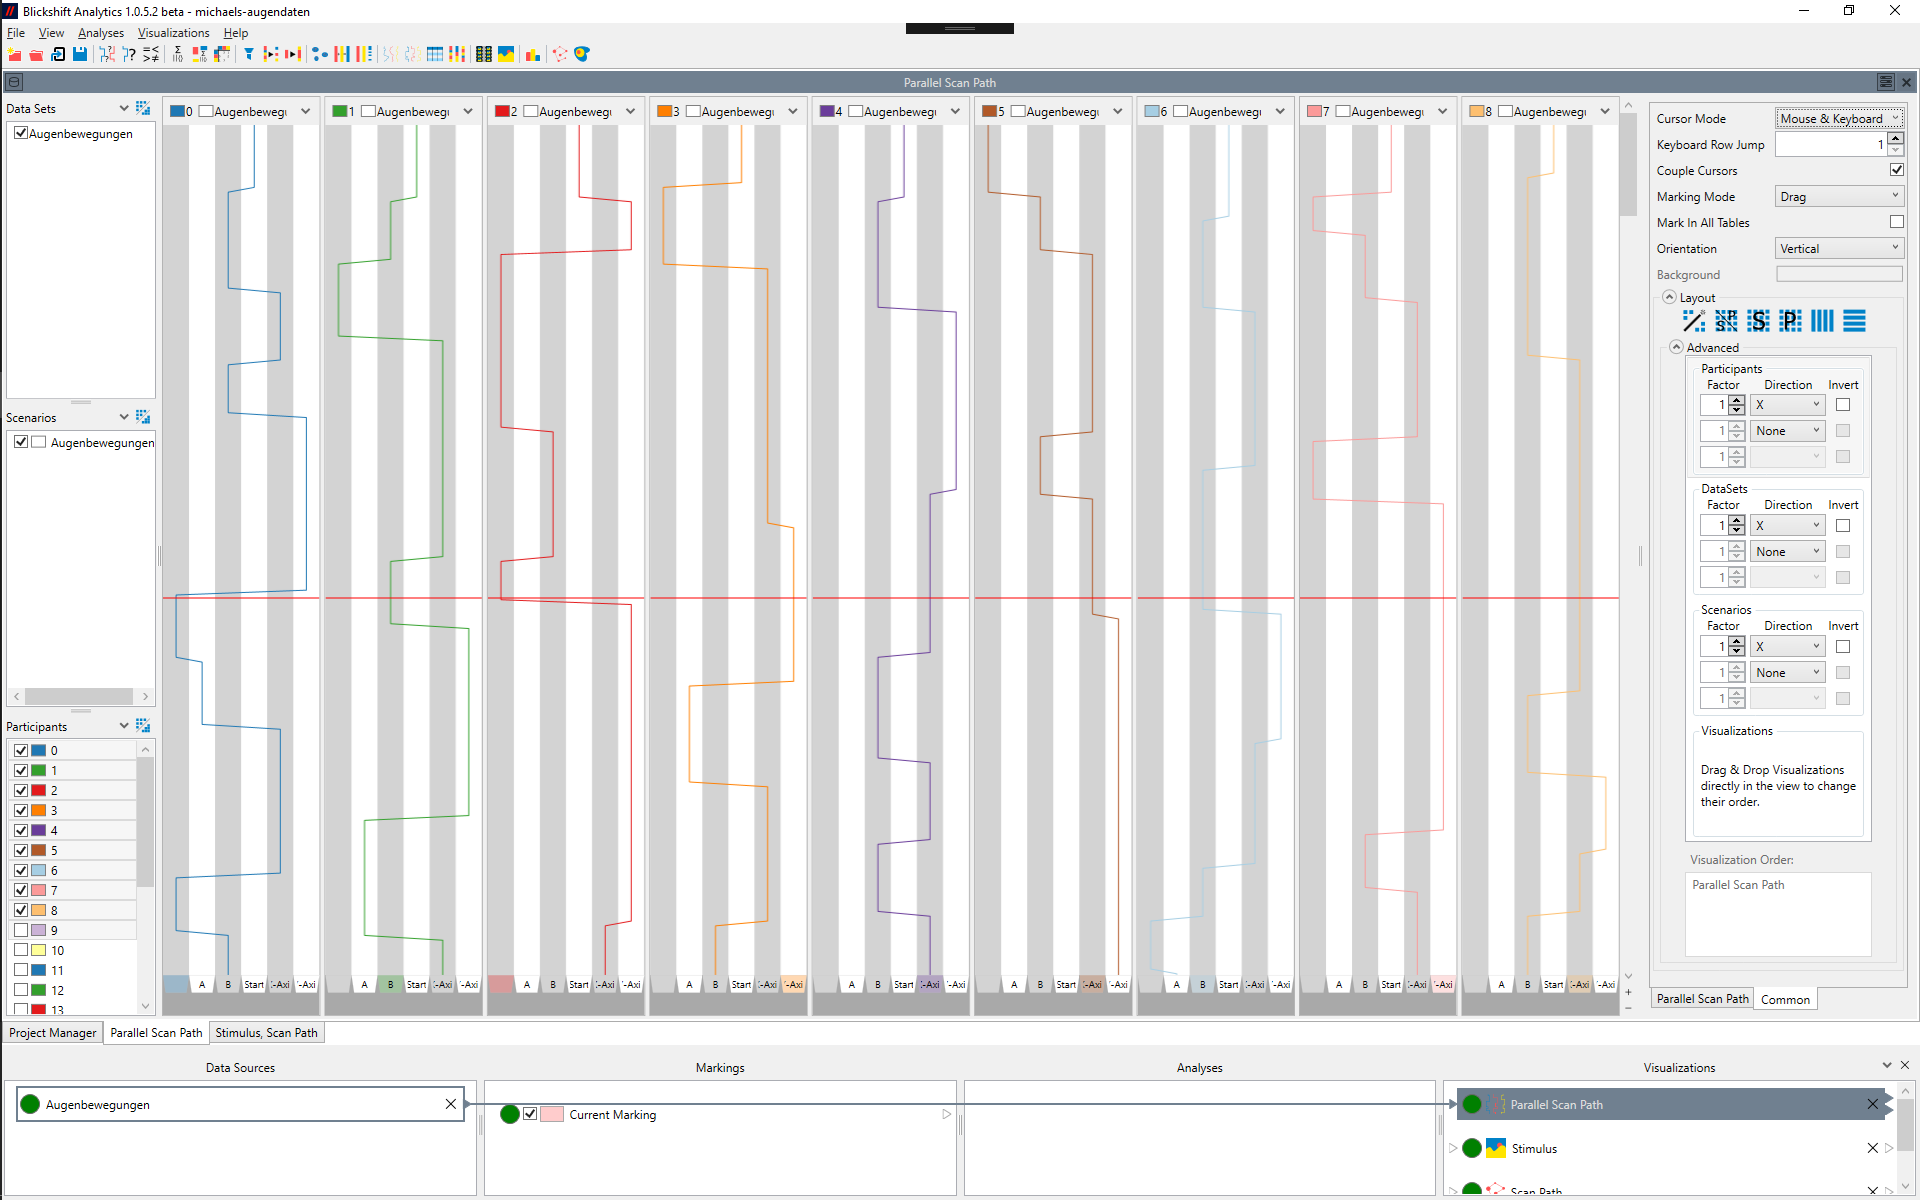
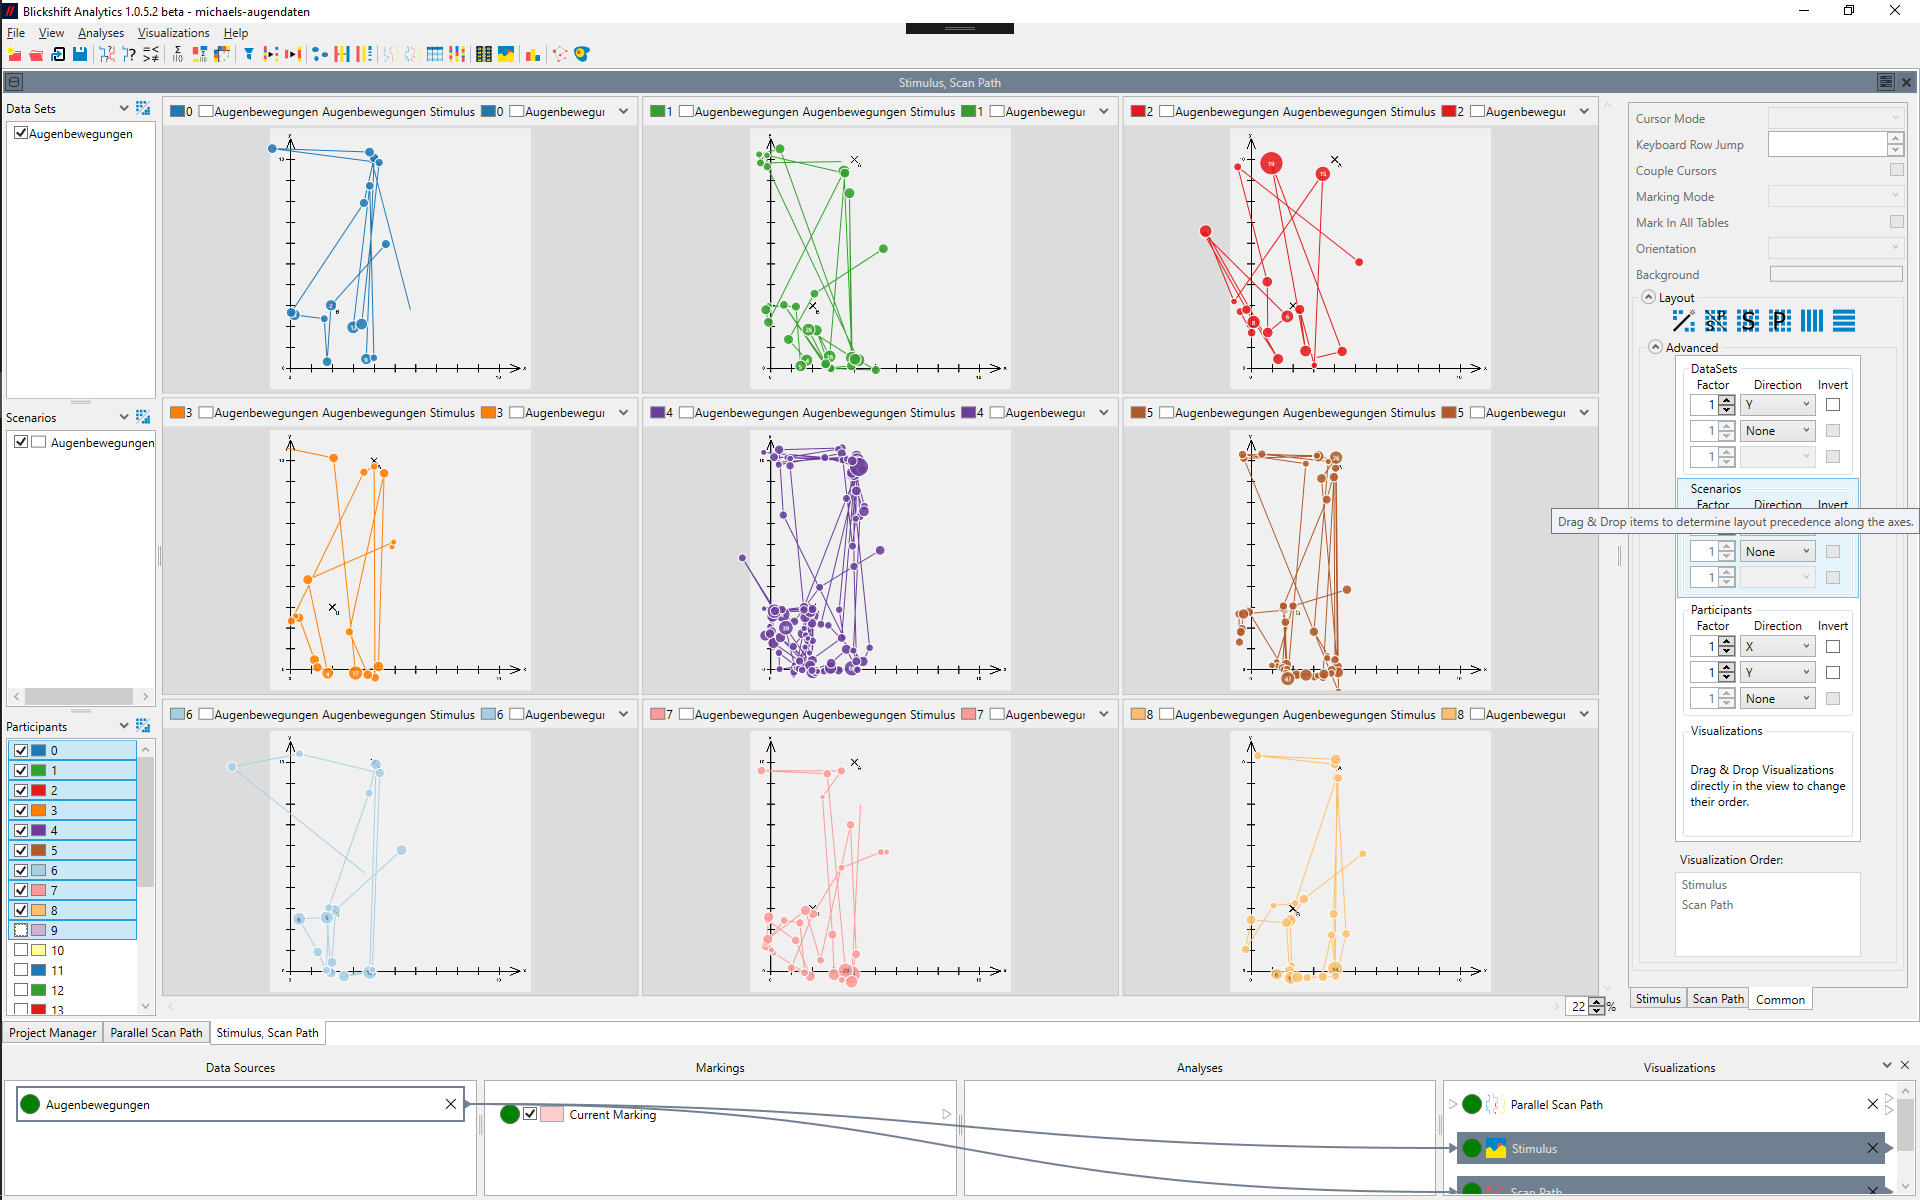
There are four dimension, in which visualization windows can exist: Data Set, Scenario, Participant (as in the Input Selection), and Visualization, i.e. different visualizations displayed in the same dashboard window. This means that, if no aggregation is activated, a visualization can exist for each DataSet / Scenario / Participant / Visualization combination. These dimension are called "visualization dimensions". They can be laid out in three dimensions: X Axis, Y Axis, and Stacked (on top of each other). These dimensions are called layout dimensions. The Advanced Layout settings makes it possible to directly influence how the visualization dimensions are mapped onto the the layout dimensions and thus how the visualizations are arranged on the screen.
For each visualization dimension except "Visualization" it is possible to assign up to three layout dimensions. In most cases, one or two layout dimensions will suffice. For example setting "Participants" to "X" only will result in all participants being shown next to each other along the X direction (Figure 5). Setting it to "X" and "Y" will create a two-dimensional grid of participants (Figure 6). By setting the "Factor" setting, it is possible to influence the ratio of the grid. The "Invert" checkbox will invert the layout direction, i.e. the last participant will be displayed first.
The "Visualization" visualization dimension does not have the same settings as the other visualization dimensions. The reason is that the layout of visualizations can be determined directly in the visualization area via drag and drop of the header of the visualization windows. Note that dragging and dropping a visualization window will always affect all windows that display the same visualization, but never affects the other visualization dimensions. If you drag & drop a window while the Layout Wizard is activated, the Layout Wizard becomes deactivated automatically. If visualizations are displayed on top of each other and you want to select one for drag & drop, click on the arrow in the header of the visualization window and select the visualization from menu that opens to initiate the drag.
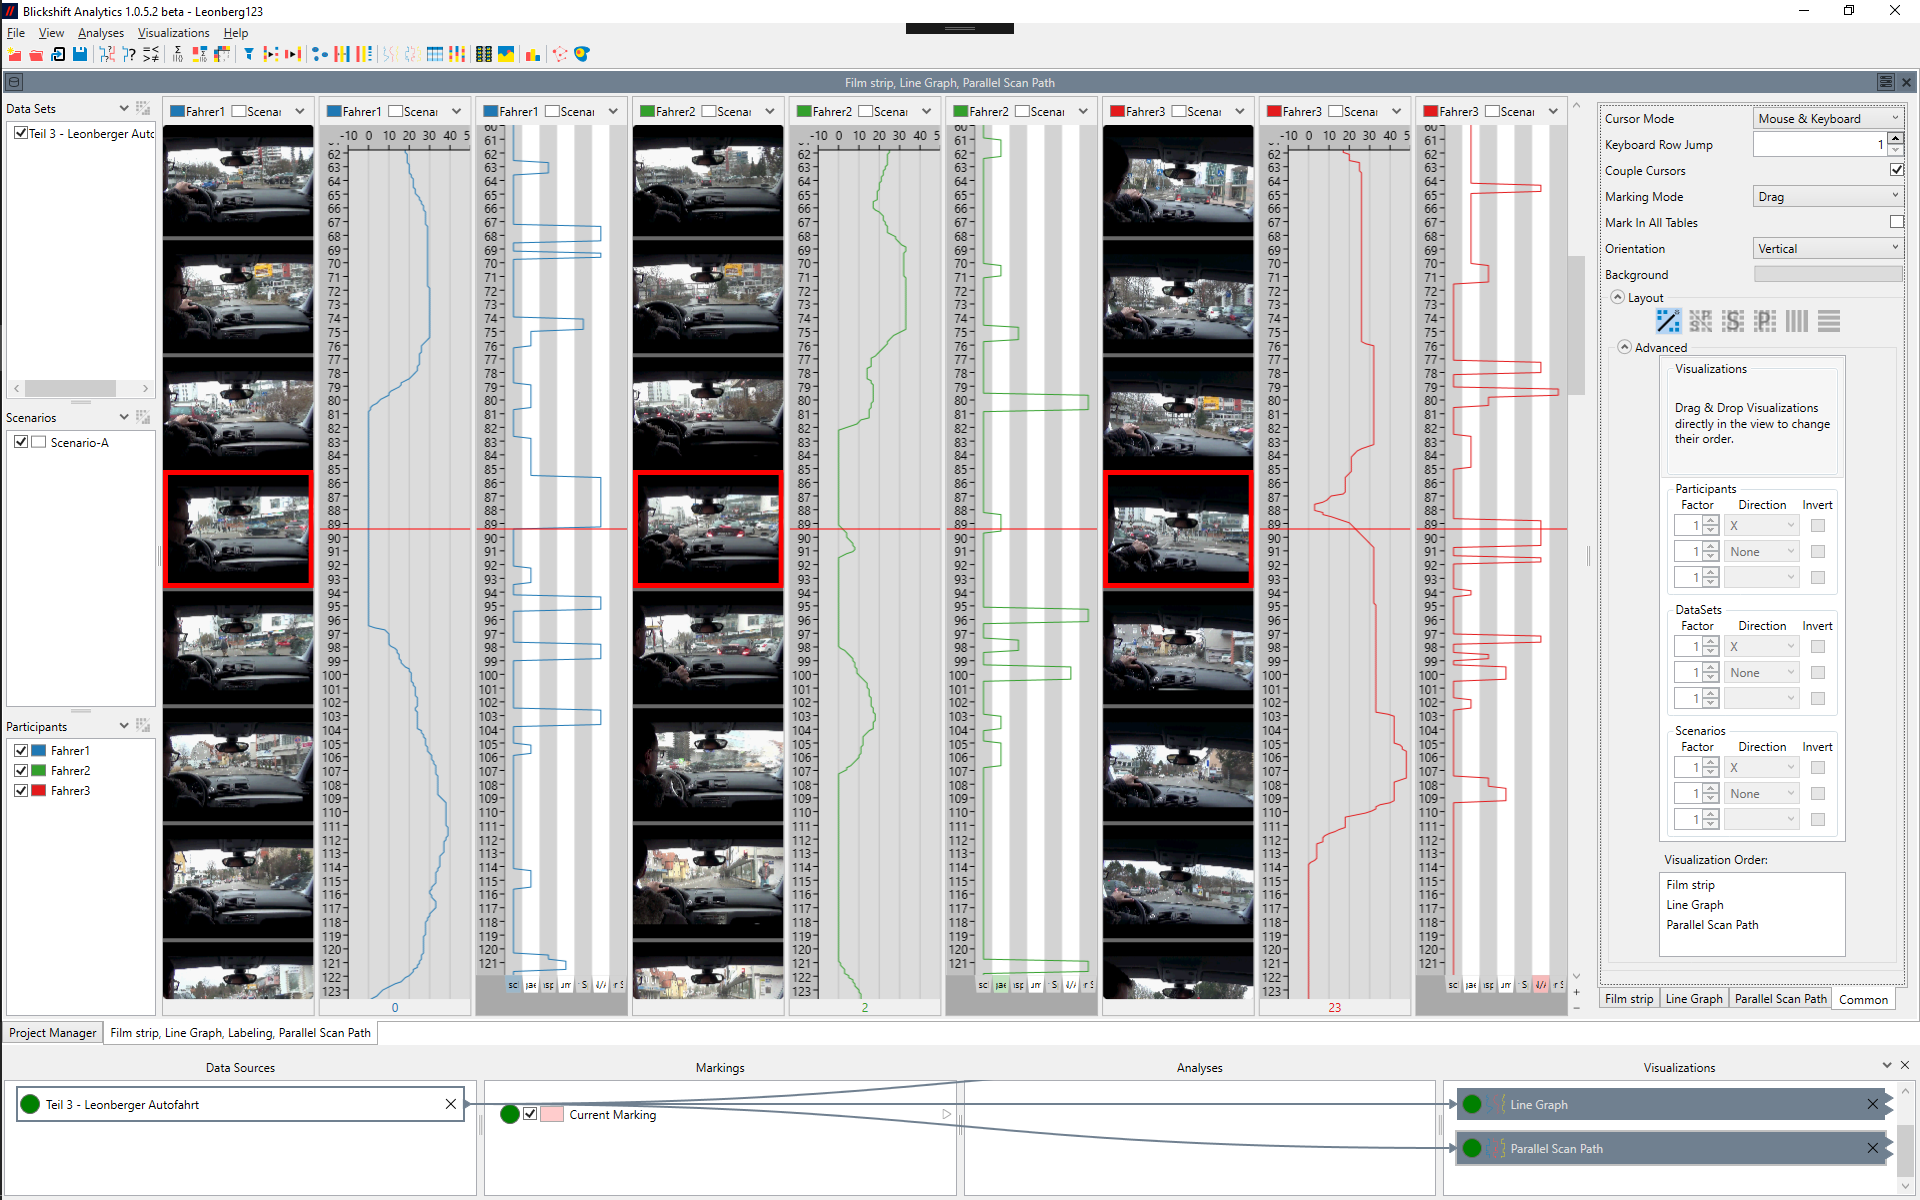
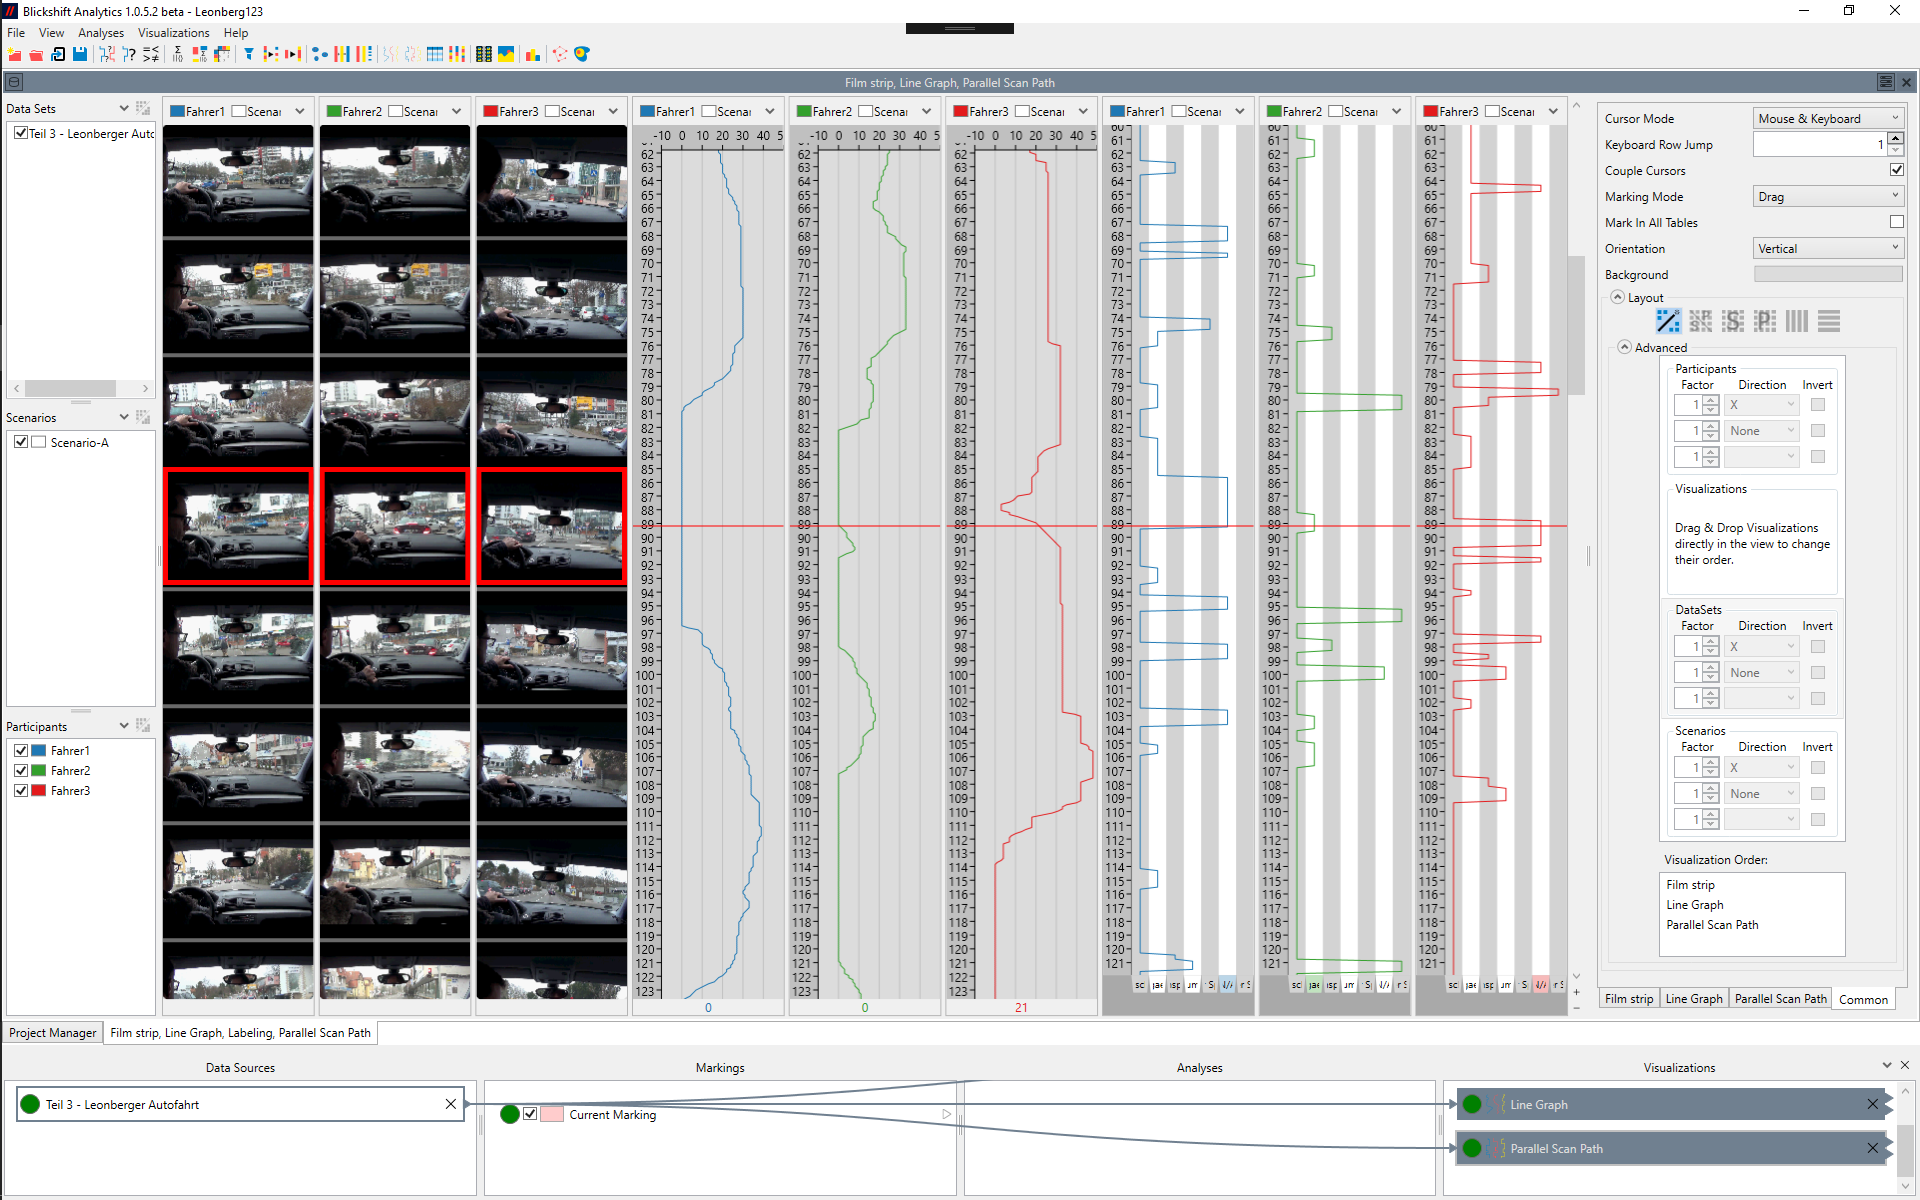
Additionally, the order of the visualization window items can be changed via Drag&Drop. This order determines their precedence, e.g. whether each visualization of one participant is displayed next to each other (figure 7) or all participants are shown with the same visualization next to each other (figure 8).
Figure 7: A layout with visualization precedence: Because visualizations have a higher precedence than participants in the advanced layout section, different visualizations for the same participant are shown next to each other.
Visualization Order
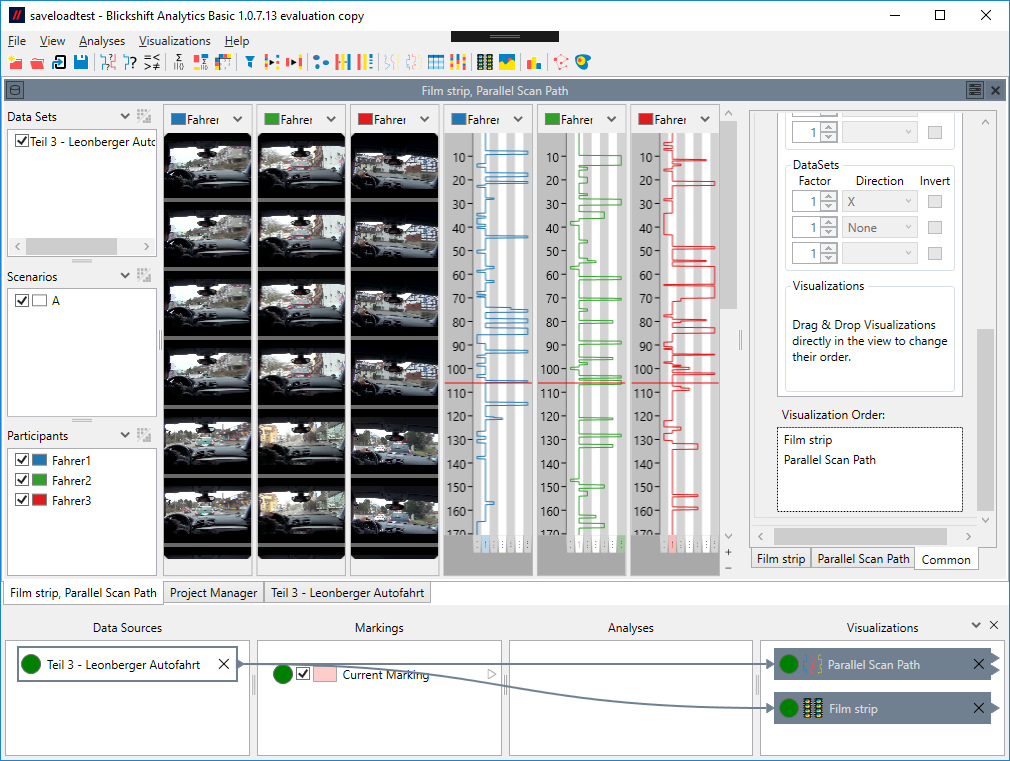
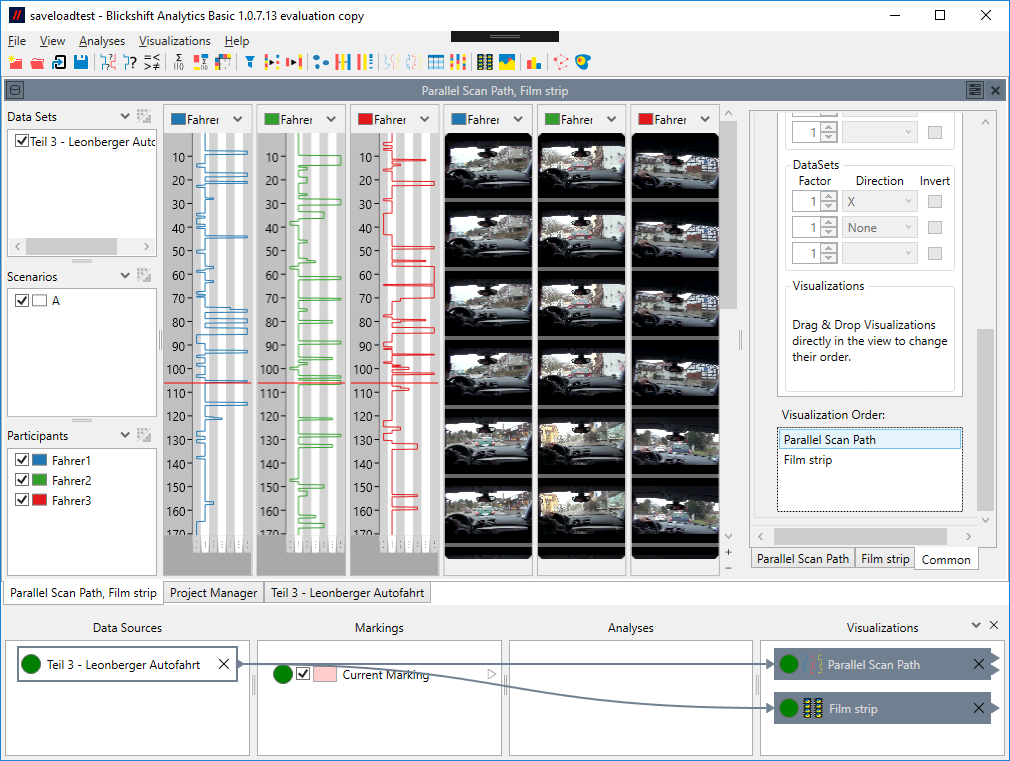
In the lower part of the Advanced Layout settings, the order of displayed visualizations can be changed. This is only possible as long as the Layout Wizard is active, and determines the order of visualizations within the layout that is determined by the Layout Wizard. Figures 9 and 10 show the same visualizations laid out by the layout wizard, but with differing visualization orders.
Figure 9: A layout created by the layout wizard, where the film strip is above the parallel scan path in the visualization order.
