Beyond heat maps and scan paths
The world today
Heat maps and scan paths are the standard visualization technique for eye tracking data.
Typically, heat maps show the fixation distribution over a stimulus. For example, Figure 1 (left) shows that most participants in this experiment have focused on the points A and B of the stimulus, see Figure 1 (middle). However, Figure 1 (right) shows the same data with the same visualization technique. What has happened here? Only two parameters have been changed during the so-called rendering process: The Kernel size and the standard deviation. The results now look quite differently. The point is, that in most presentations or reports these important parameters are not given! So, heat maps look nice but could be a very magical way of presenting fixations!
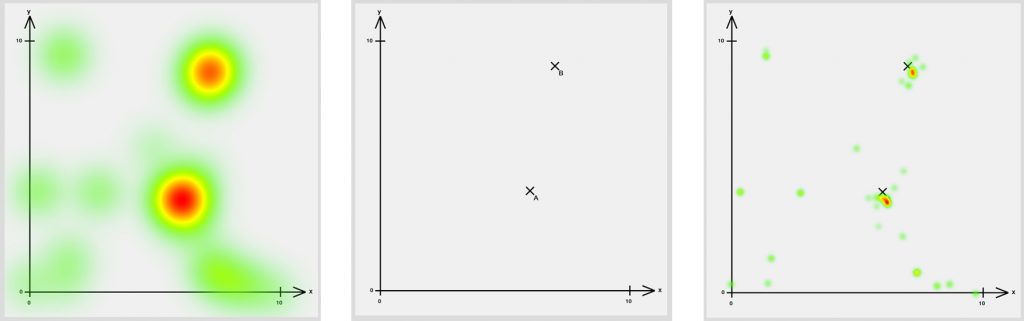
Figure 1: Stimulus (left) and two heat maps (middle and right) showing same fixations but with different visualization parameters.
Scan paths show the order of fixations performed by a participant during an experiment (Figure 2). The drawback is described straightly forward: Did you ever try to analyze the scan path of more than ten participants? From my experience, this is a very time-consuming task. In my first eye tracking experiment of my career in 2009 I wanted to analyze eye movements of 30 participants having seen 30 stimuli in three segments of tasks. So, the goal was to view 2.700 scan paths! The good information is, that we have never started to do this. We did something else: We have developed new analysis techniques for large eye tracking data beyond heat maps and scan paths!
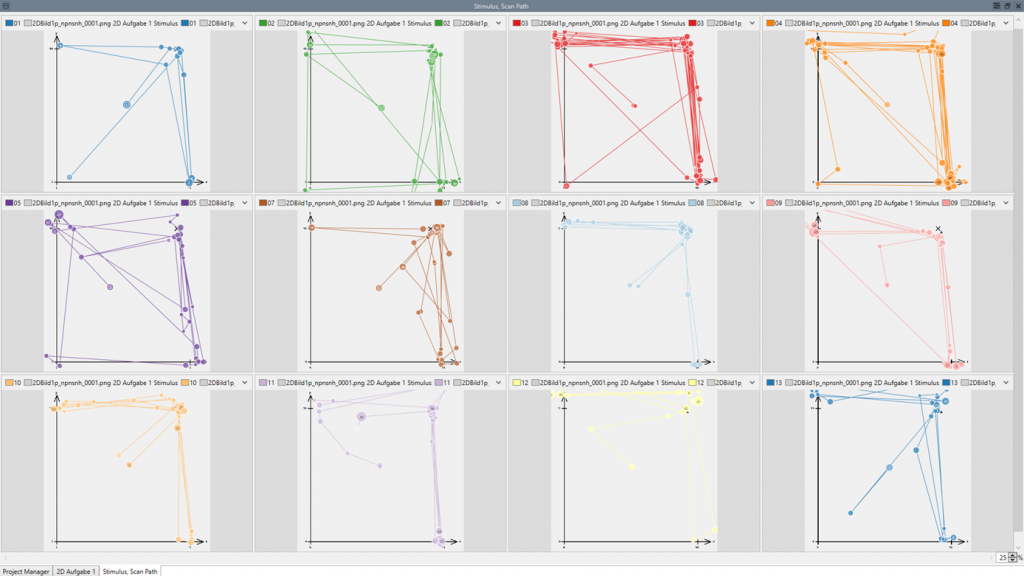
Figure 2: Twelve of 2.700 scan path which we had to view in our first eye tracking experiment.
The thing with statistics is …
For us, the first question was, if statistics could help us? For example, with statistics we can compute average values, medians and other results. And, there are further powerful tests like t-Tests or ANOVAs. However, we quickly have learnt that most of statistical tests are only useful, if we have deleted most of the outliers. Secondly, the results show averaged eye movement behavior. In case of eye movements averaging means to „smooth out“ all details. This leads to the fact, that interesting patterns in the eye movements are lost during the analysis.
The world of tomorrow
This was my situation in 2009. I had to analyze the 2.700 scan paths for my scientific work and both solutions did not work for me. This was the moment, were we decided to develop new analysis techniques for eye tracking data at our institute.
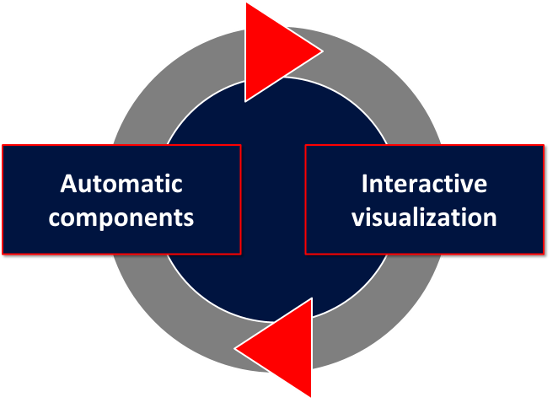
Figure 3: Visual Analytics combines powerful computational methods with modern visualizations.
The point is, that we have to think beyond eye tracking analysis today and think of what could be possible tomorrow. Therefore, we did research in other areas of data analysis and found one very promising research field which is called Visual Analytics, see Figure 3. This relatively new research domain combines modern visualization techniques with computational methods. In its basics, Visual Analytics allows us to analyze large data sets both with the power of computers and the human ability to visually identify patterns in visualization. It’s less a hypothesis-based analysis method, rather an explorative way of analyzing the experiment.
We are convinced that Visual Analytics is the key for finding new insight in eye movements, reducing costs for a detailed analysis and bring the eye tracking technology on a complete new level.
 About the author
Dr. Michael Raschke is Co-Founder and managing director of Blickshift GmbH and an expert for a visualization-based eye movement analysis. Michael is author and co-author of more than 40 scientific publications in the fields of eye tracking visualization, visual analytics, cognitive modeling and human-computer interaction.
Thank you for sending your comments to the author directly.