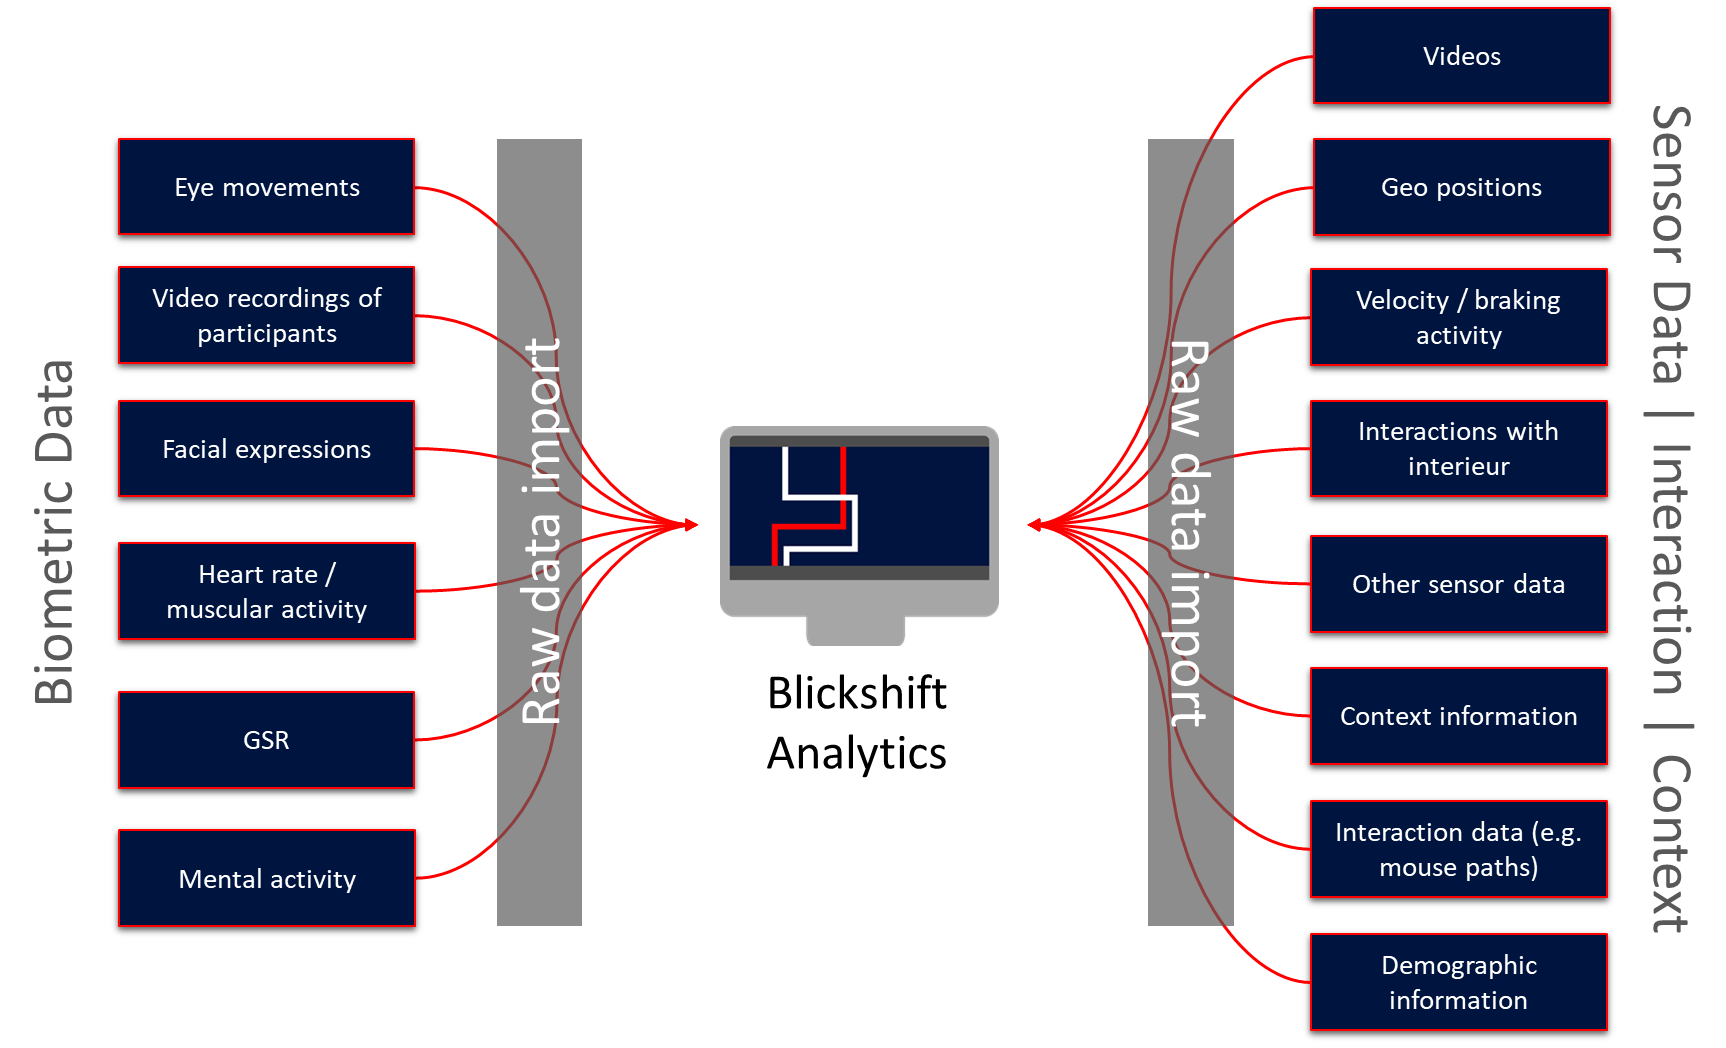
Visualizations Features
Film Strip
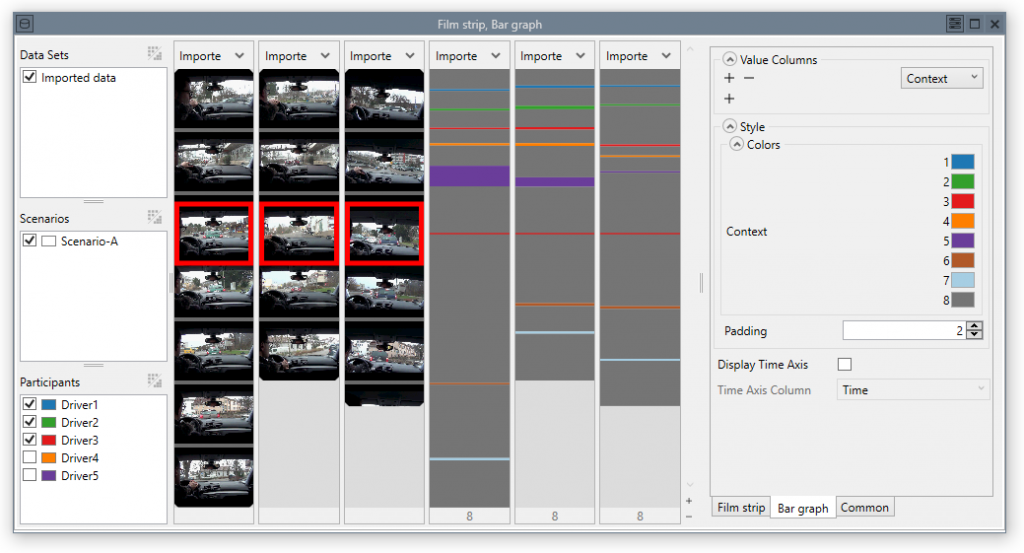
Displays videos from the experiment in a time-dependent view, allowing for easy parallelization with other visualizations in order to visually correlate participants’ behaviors and recorded data.
Parallel Scan Path
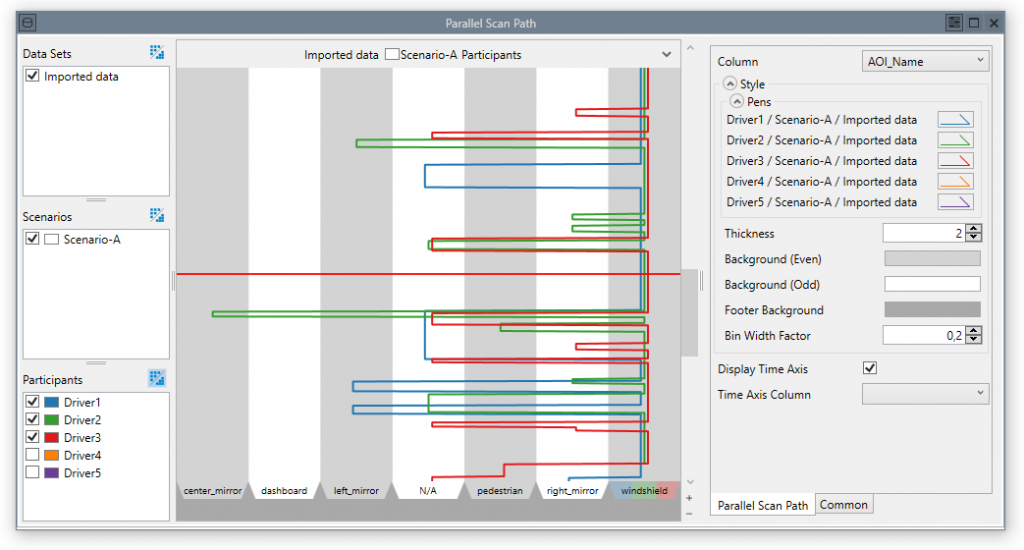
Shows various characteristics of scan paths, such as gaze durations, transitions, and eye shift frequencies at one glance.
Line Graph
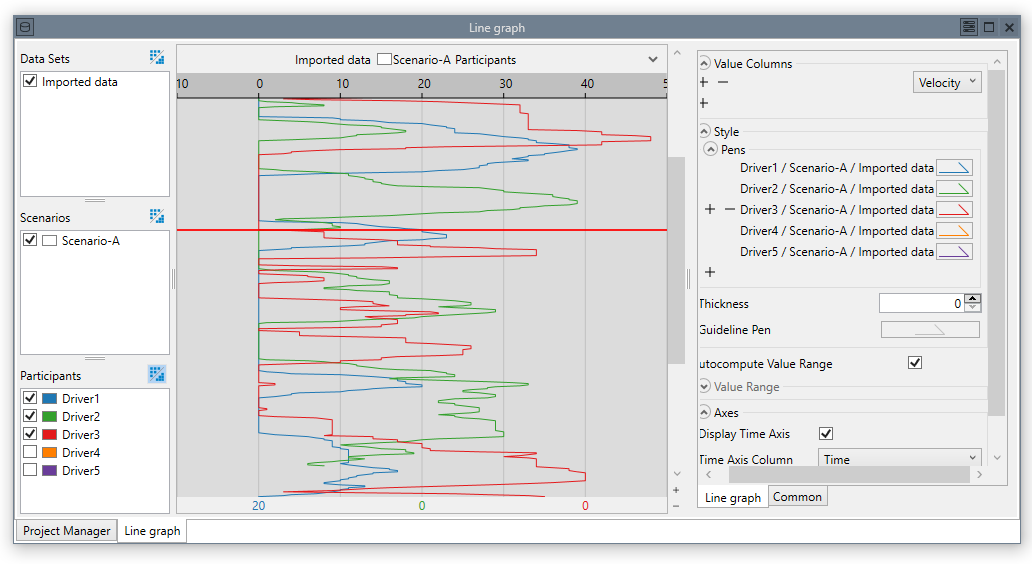
Displays standard line graphs, specifically suited for data from non-eye-tracking sensor channels.
Bar Graph
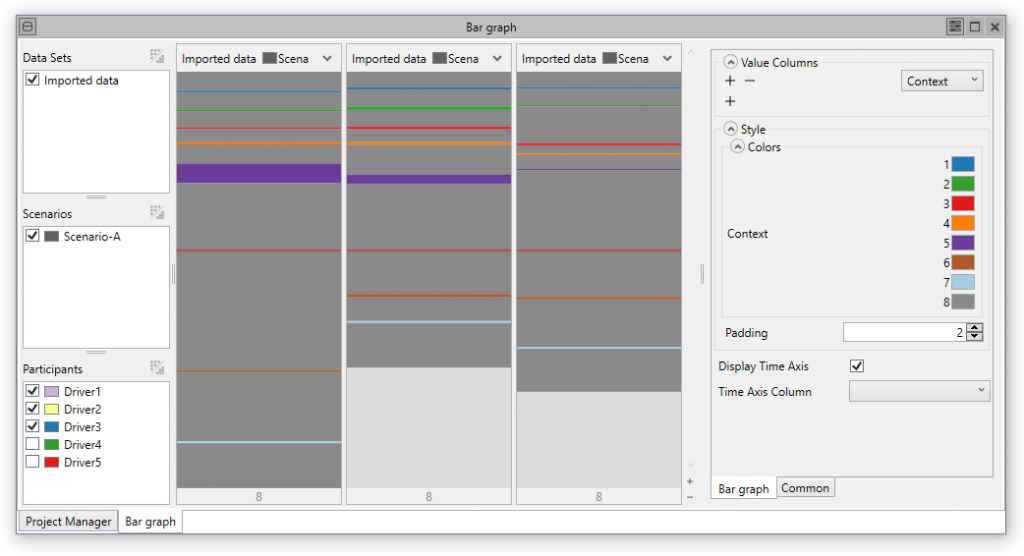
Visualizes context information such as performed tasks or other categorical data.
Drill Down View
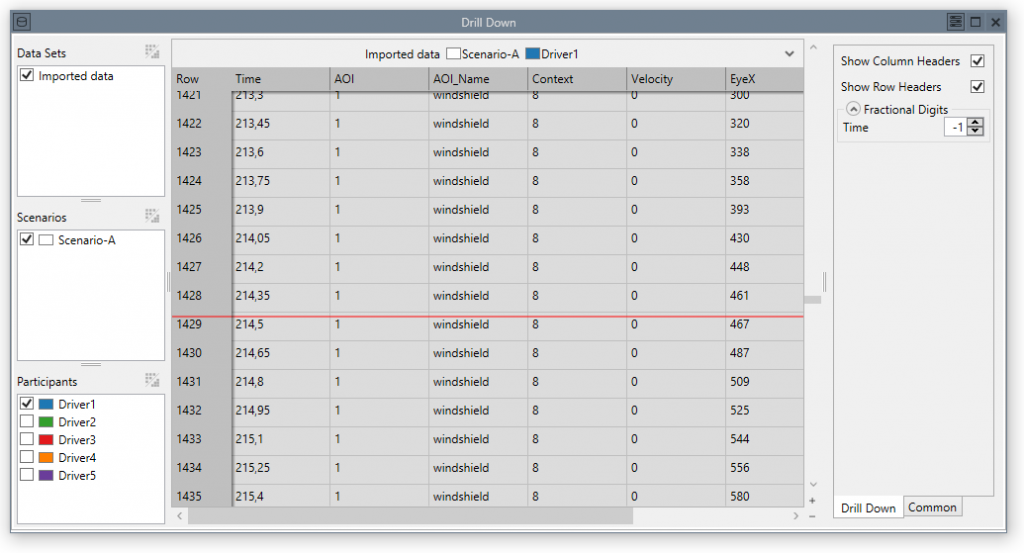
Shows the raw data or any result of an analysis in a spreadsheet-like view.
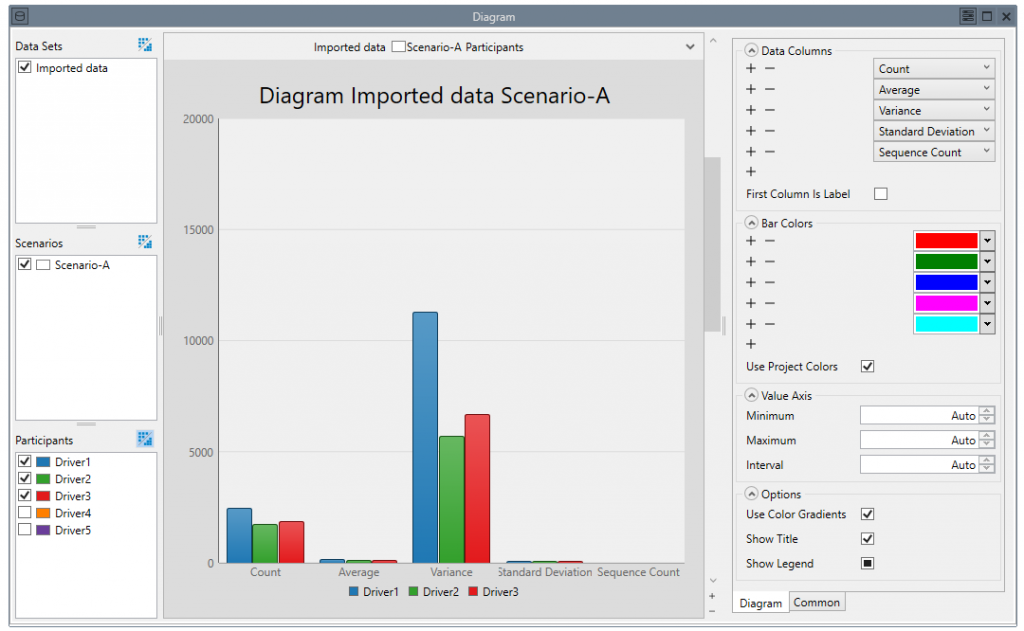
Diagram
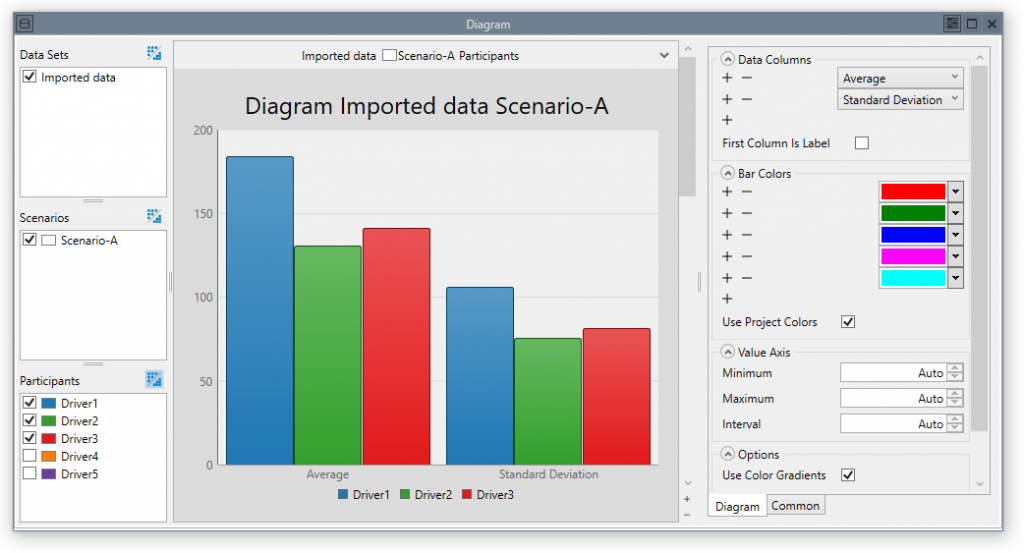
Visualizes analysis results with bar charts.
Heat Map and Scan Path
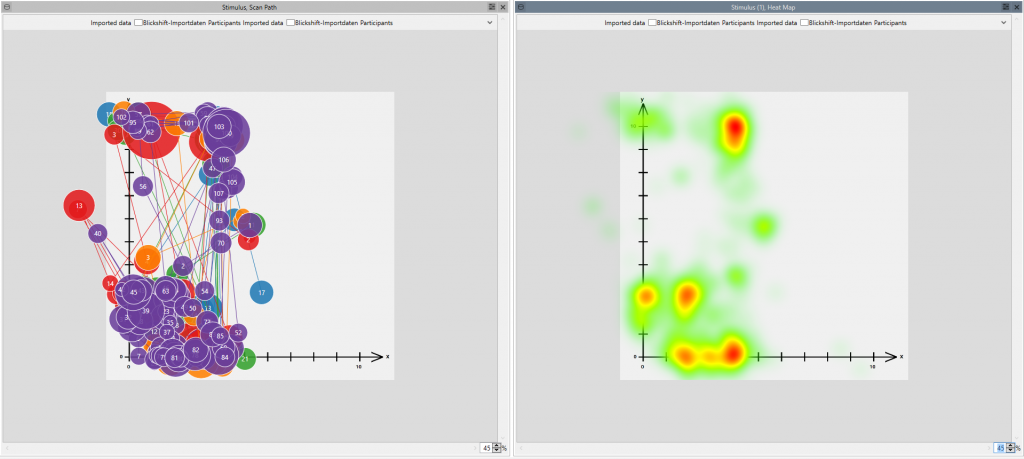
Visualizes the gaze data, or a subset of it selected in other visualizations.
Stimulus Visualization
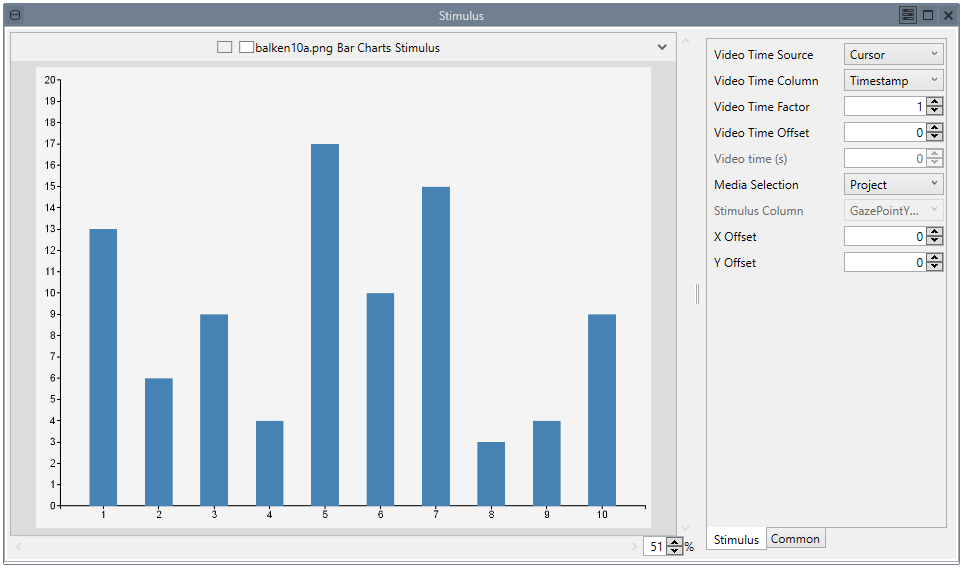
Shows stimuli in combination with other visualizations.
Analysis Features
Sequence Analysis
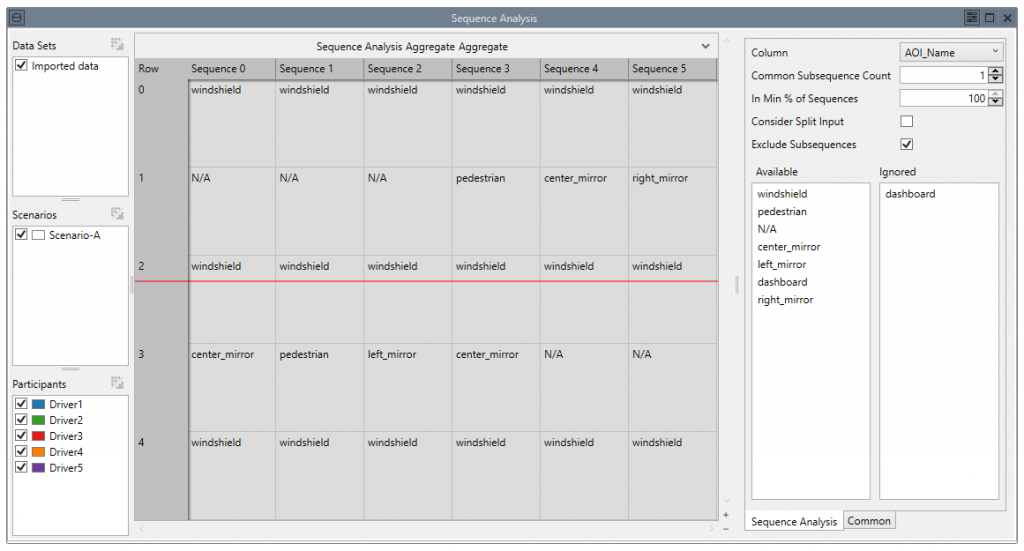
Finds eye movement patterns that are common amongst participants or scenarios.
Sequence Search
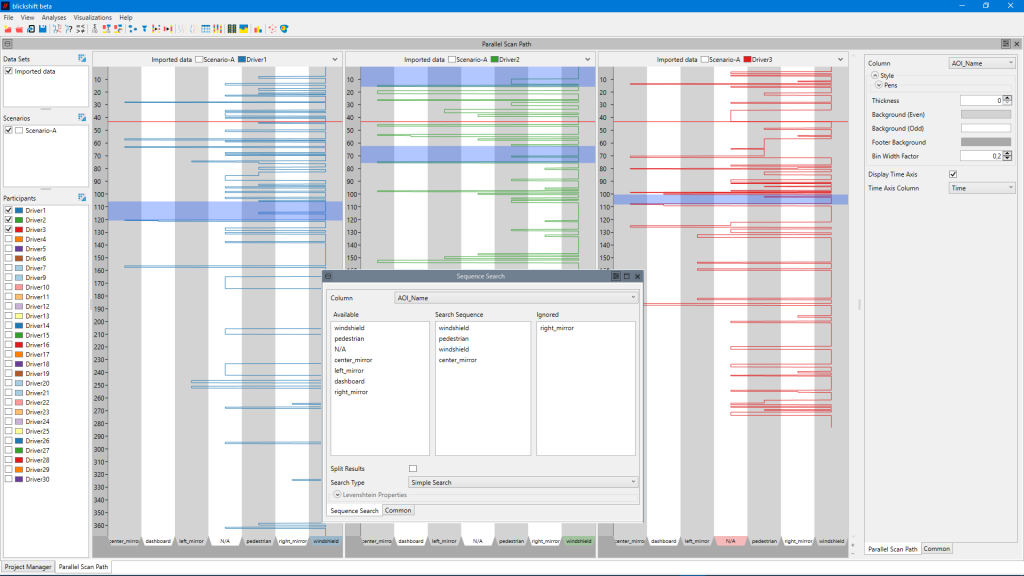
Find exact or similar eye movements patterns.
Value Search
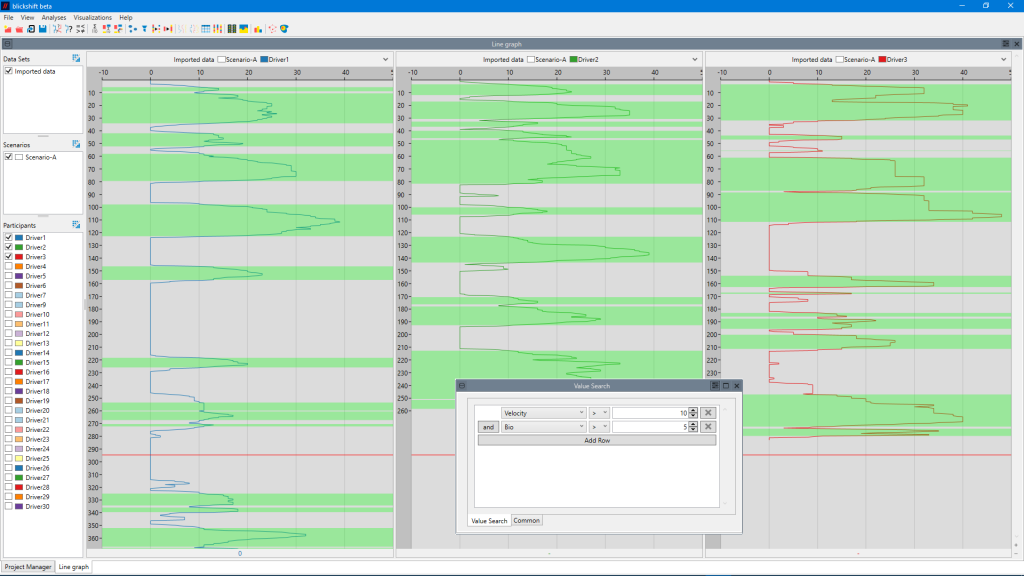
Searches for specific characteristics in the recorded data.
Adaptation of Selections
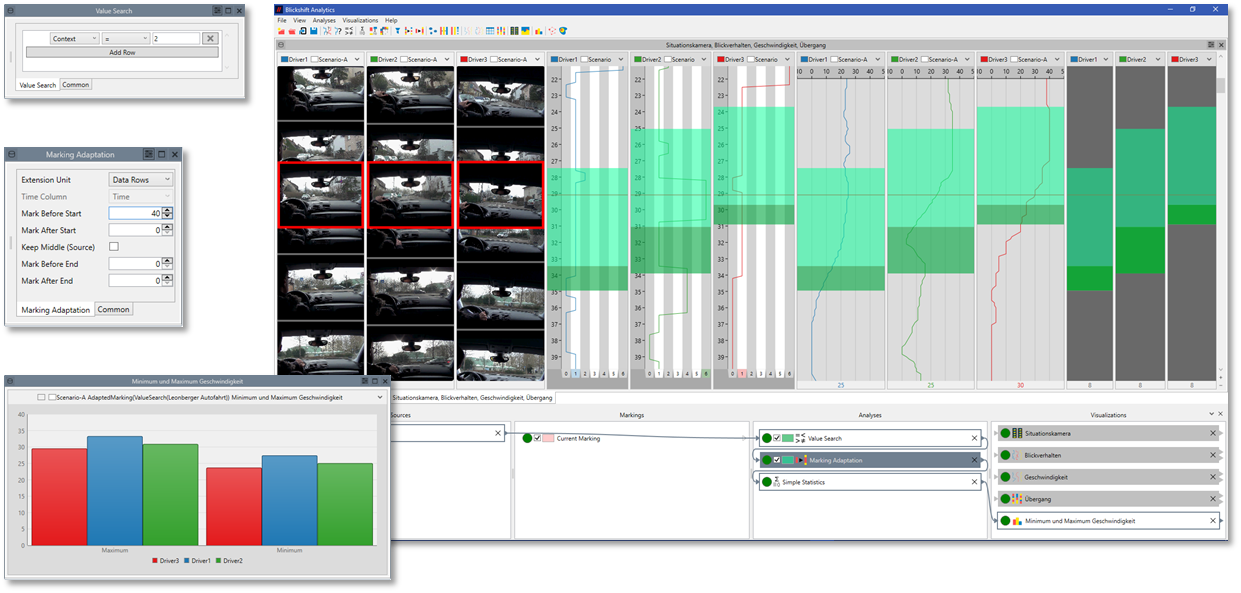
Allows adapting selections and search results in a time-dependent manner (e.g. “all data 5 seconds before the driver crossed the 100km/h threshold”).
Interactive annotation (labeling)
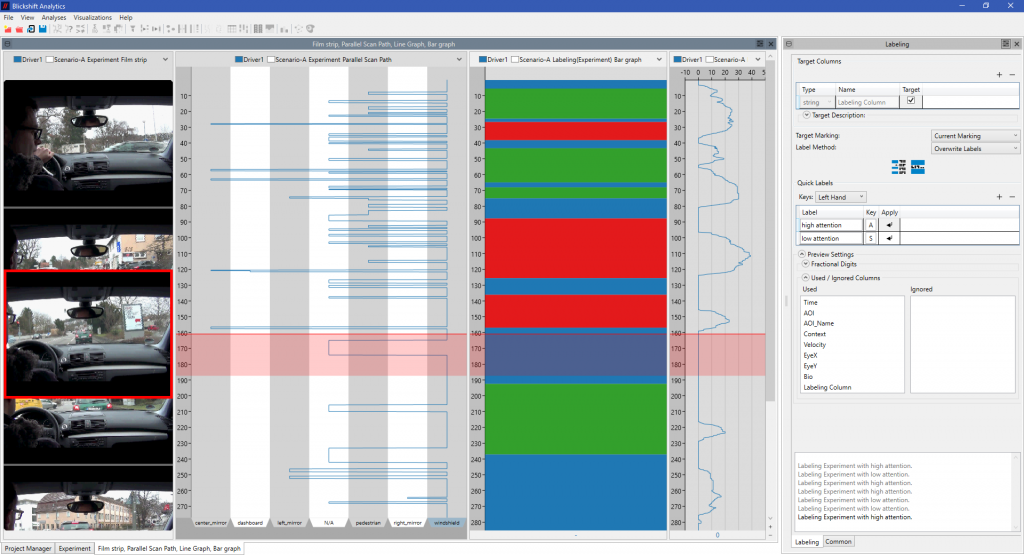
With this component you can label your data. The application domain of this component reaches from a simple annoation to generating AI training sets.
Column Compuation
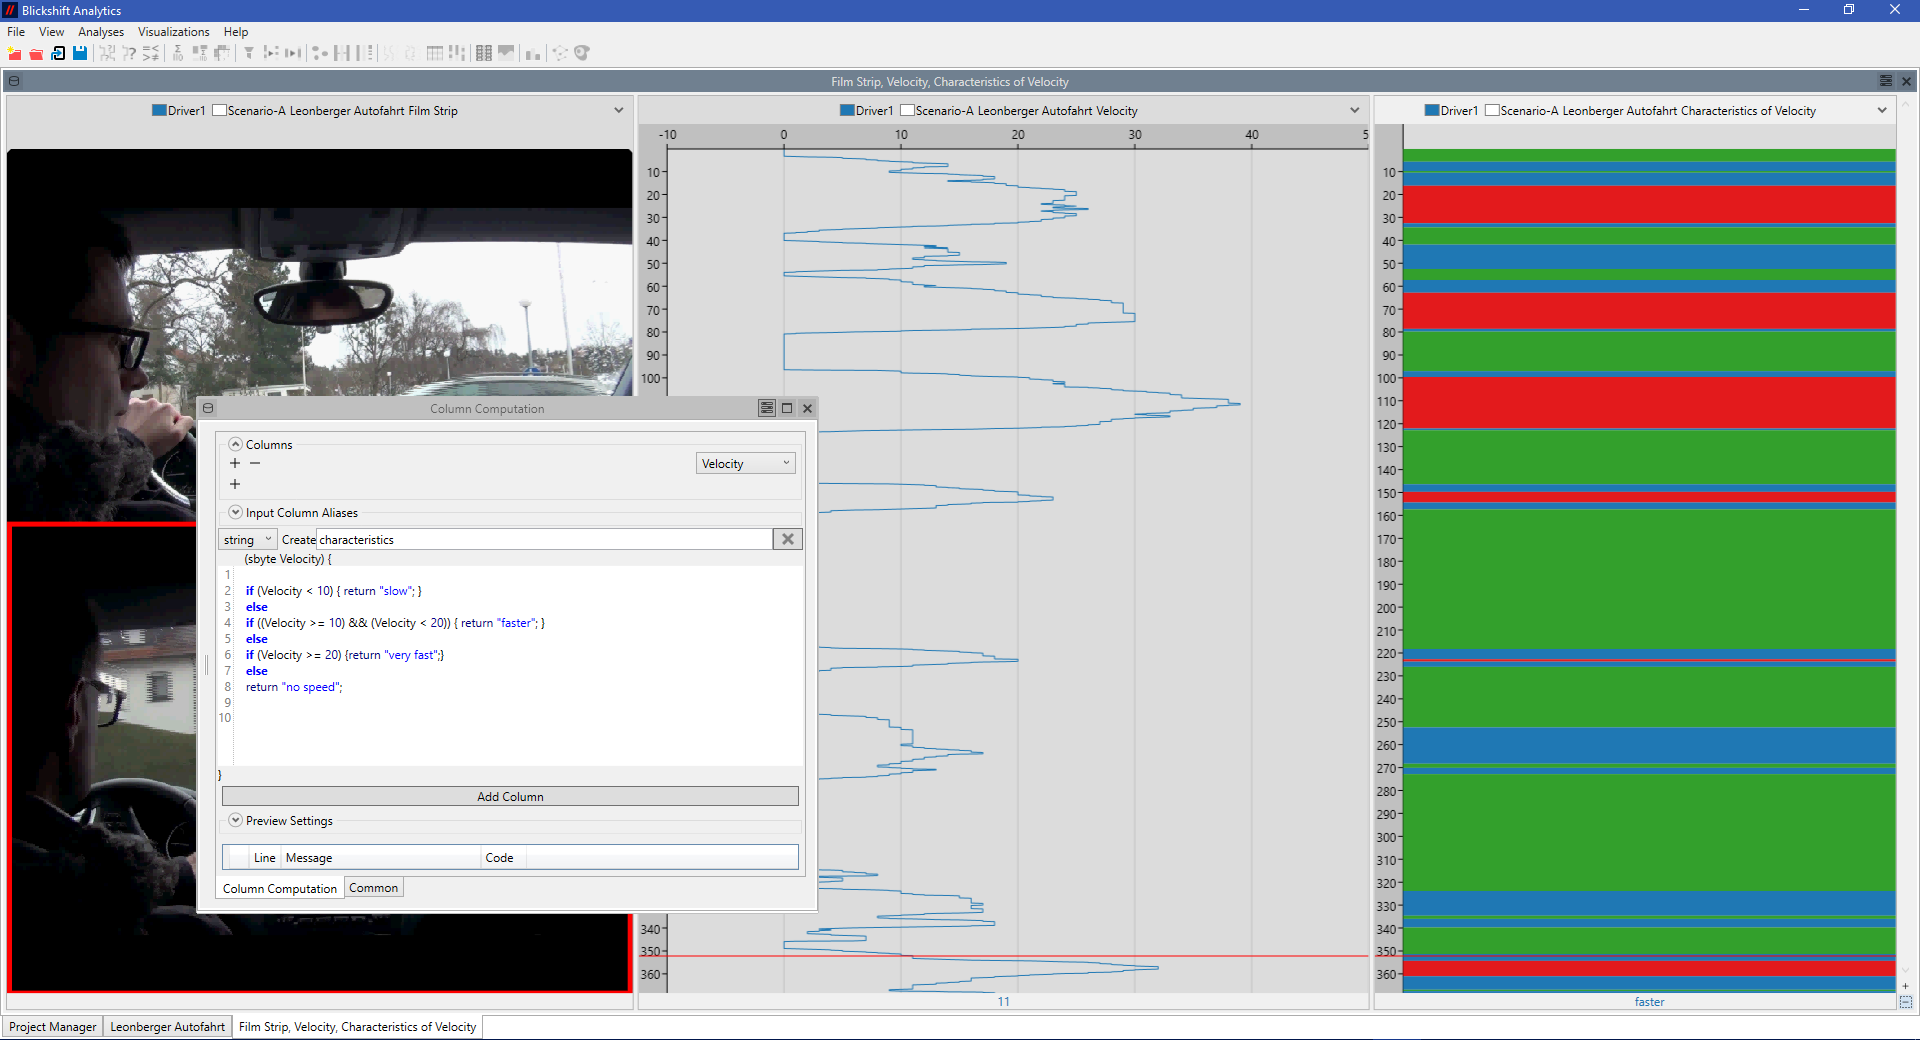
Links data columns with each other.
Simple Statistics and Gaze Duaration Statistics
Provide simple statistics on numerical data and general gaze duration metrics.
Fixation Computation
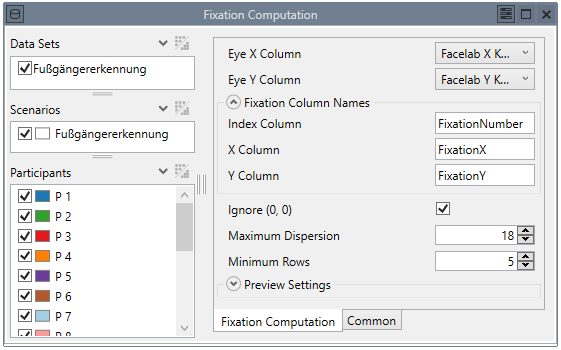
Computes fixations based on raw gaze data.
Transition Matrix
Computes number of transitions between areas of interest.
Workflow Explorer
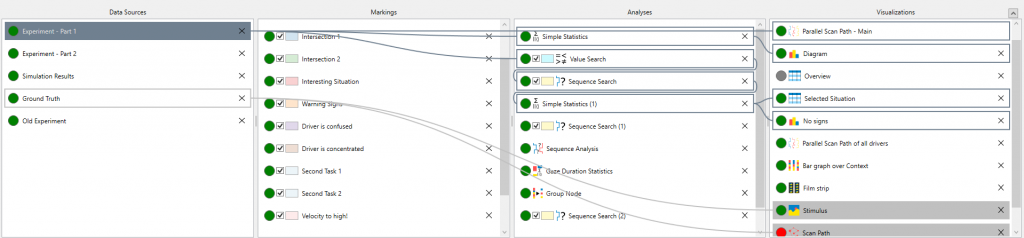
Keeps you in control at every moment of your data analysis with an intuitive overview of all open visualizations and running analysis components.
Data Import and Export
Blickshift Analytics provides a flexible importer for csv files. At any point in the analysis, computed results can be exported to csv files. Additionally, Blickshift Analytics can export all its visualizations to bitmaps or the clipboard for further use in reports or presentations.