Preview on new Version of Blickshift Analytics
We are pleased to announce that due to your great feedback over the past year, we are adding two new features to our product that you can try right away. We’re introducing a whole new set of features that will allow you to
- create dynamic areas of interest very efficiently
- and add more columns easily and quickly to your statistical metrics
Powerful new Editor for Dynamic Areas of Interest
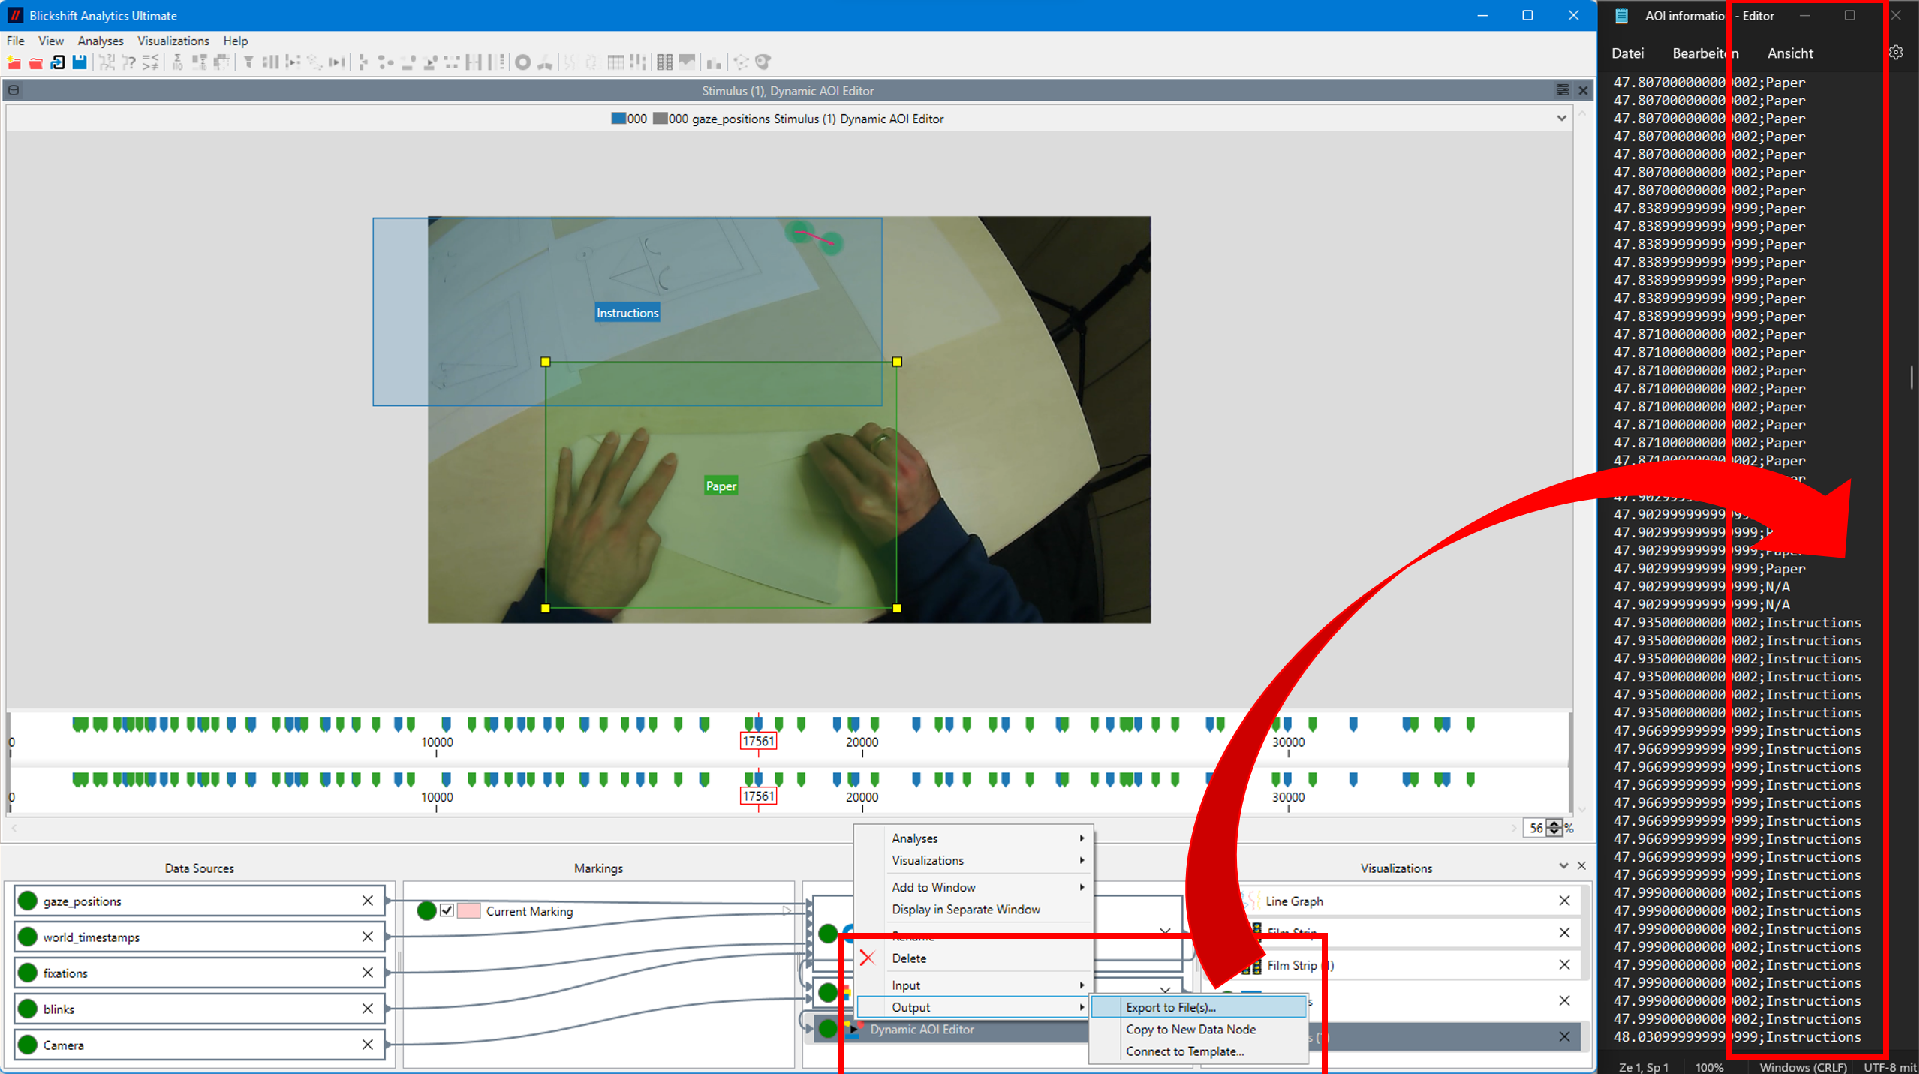
Our new feature creates dynamic areas of interest in a very efficient way, and it supports various use cases of Dynamic AOIs such as:
- Head-mounted eye tracking experiments
- Annotation in automotive experiments
- Screen-based experiments like with websites or other screen recordings
- Virtual Reality recordings
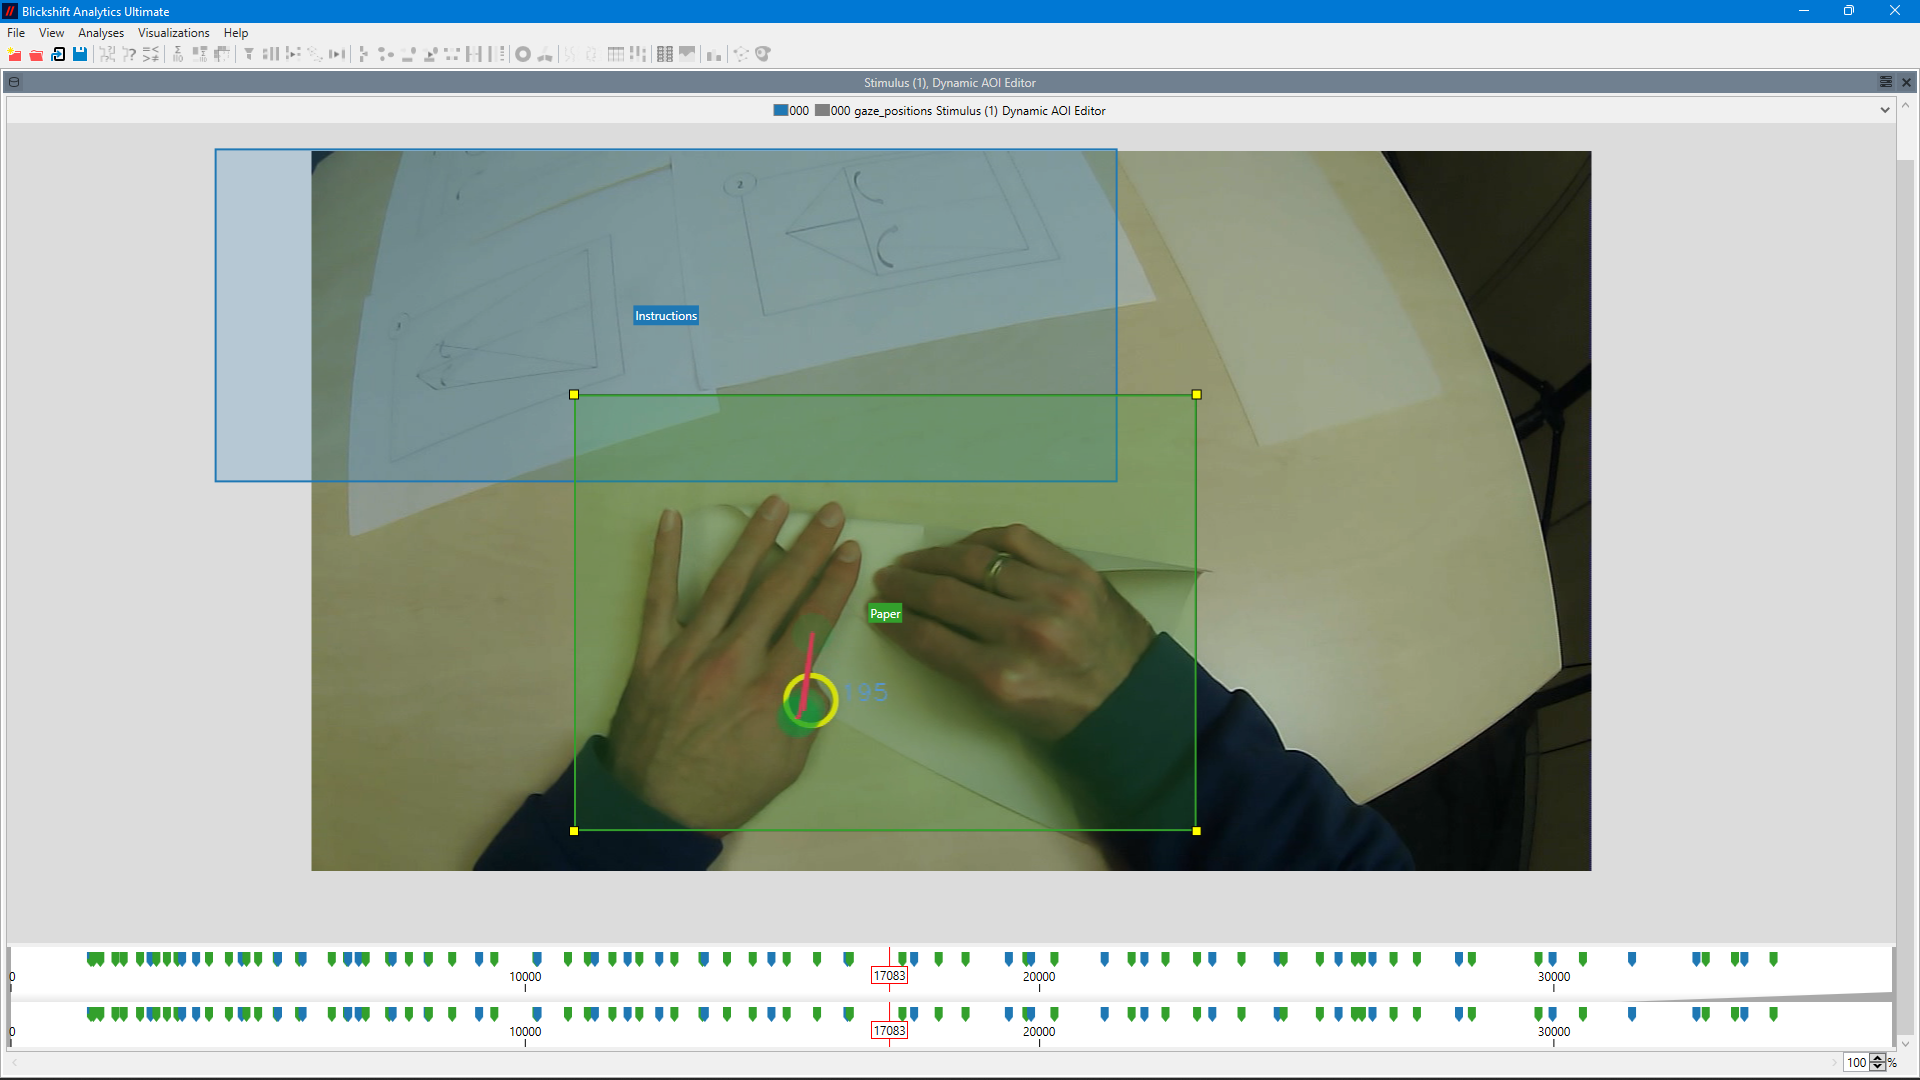 Here the participant has seen and is following the instructions to build a paper plane (Click on the image for full resolution)
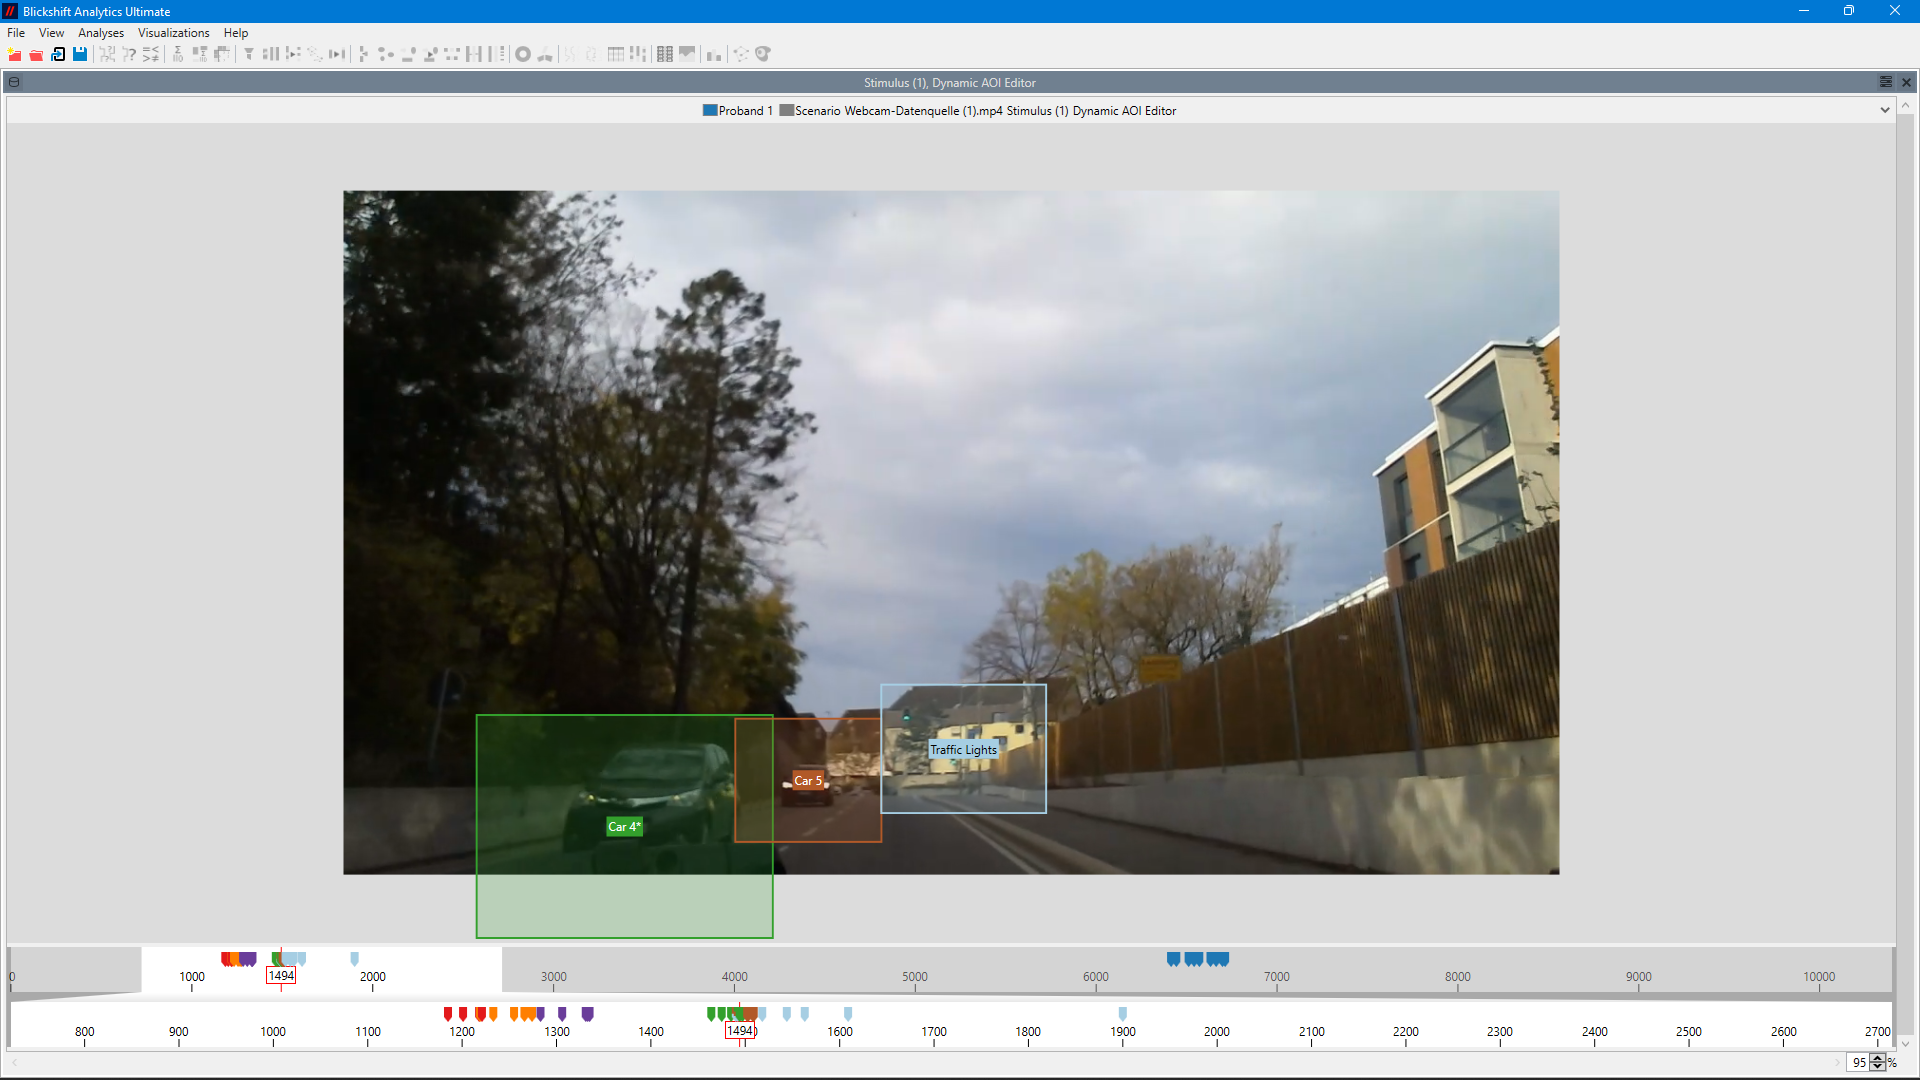 In an automotive experiment objects in the environment of the car can be annotated with areas of interest (Click on the image for full resolution)
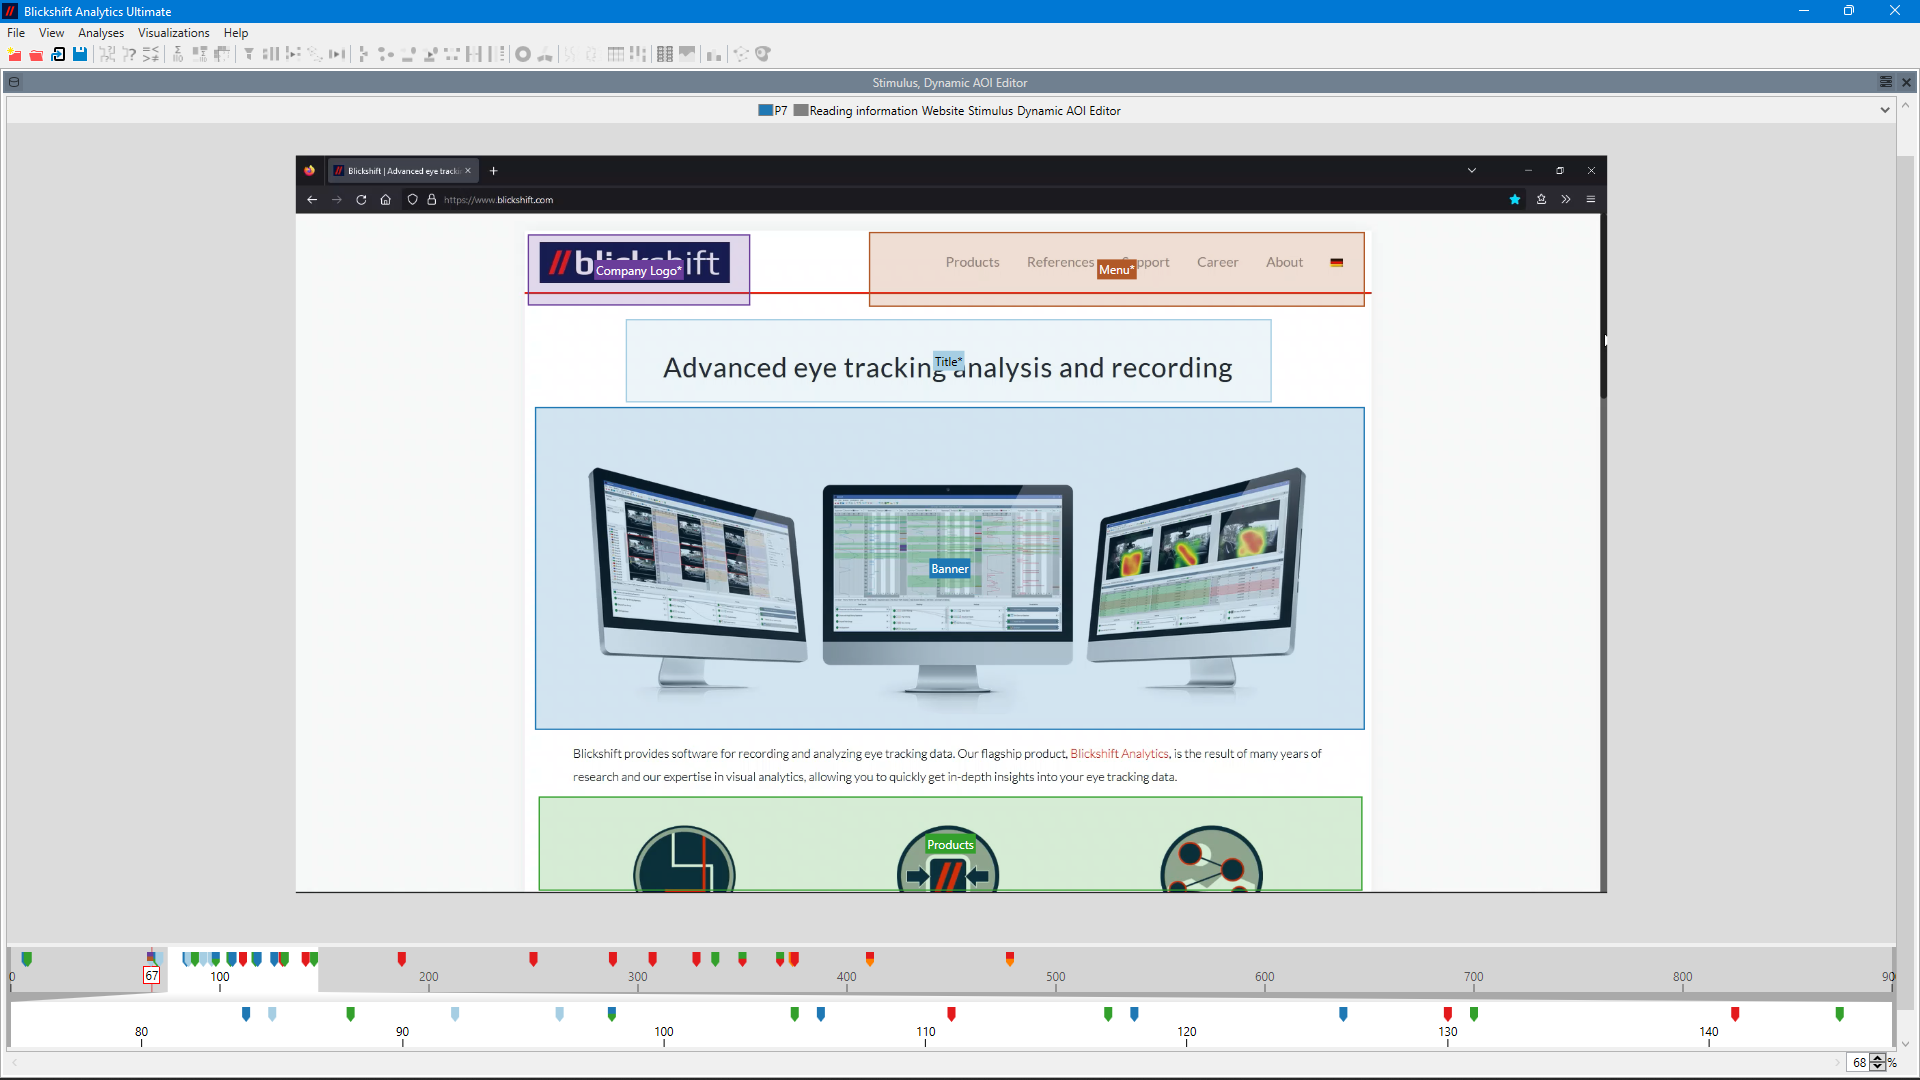 You can cover all interesting graphical elements on your screen by adding dynamic AOIs for all of them (Click on the image for full resolution)
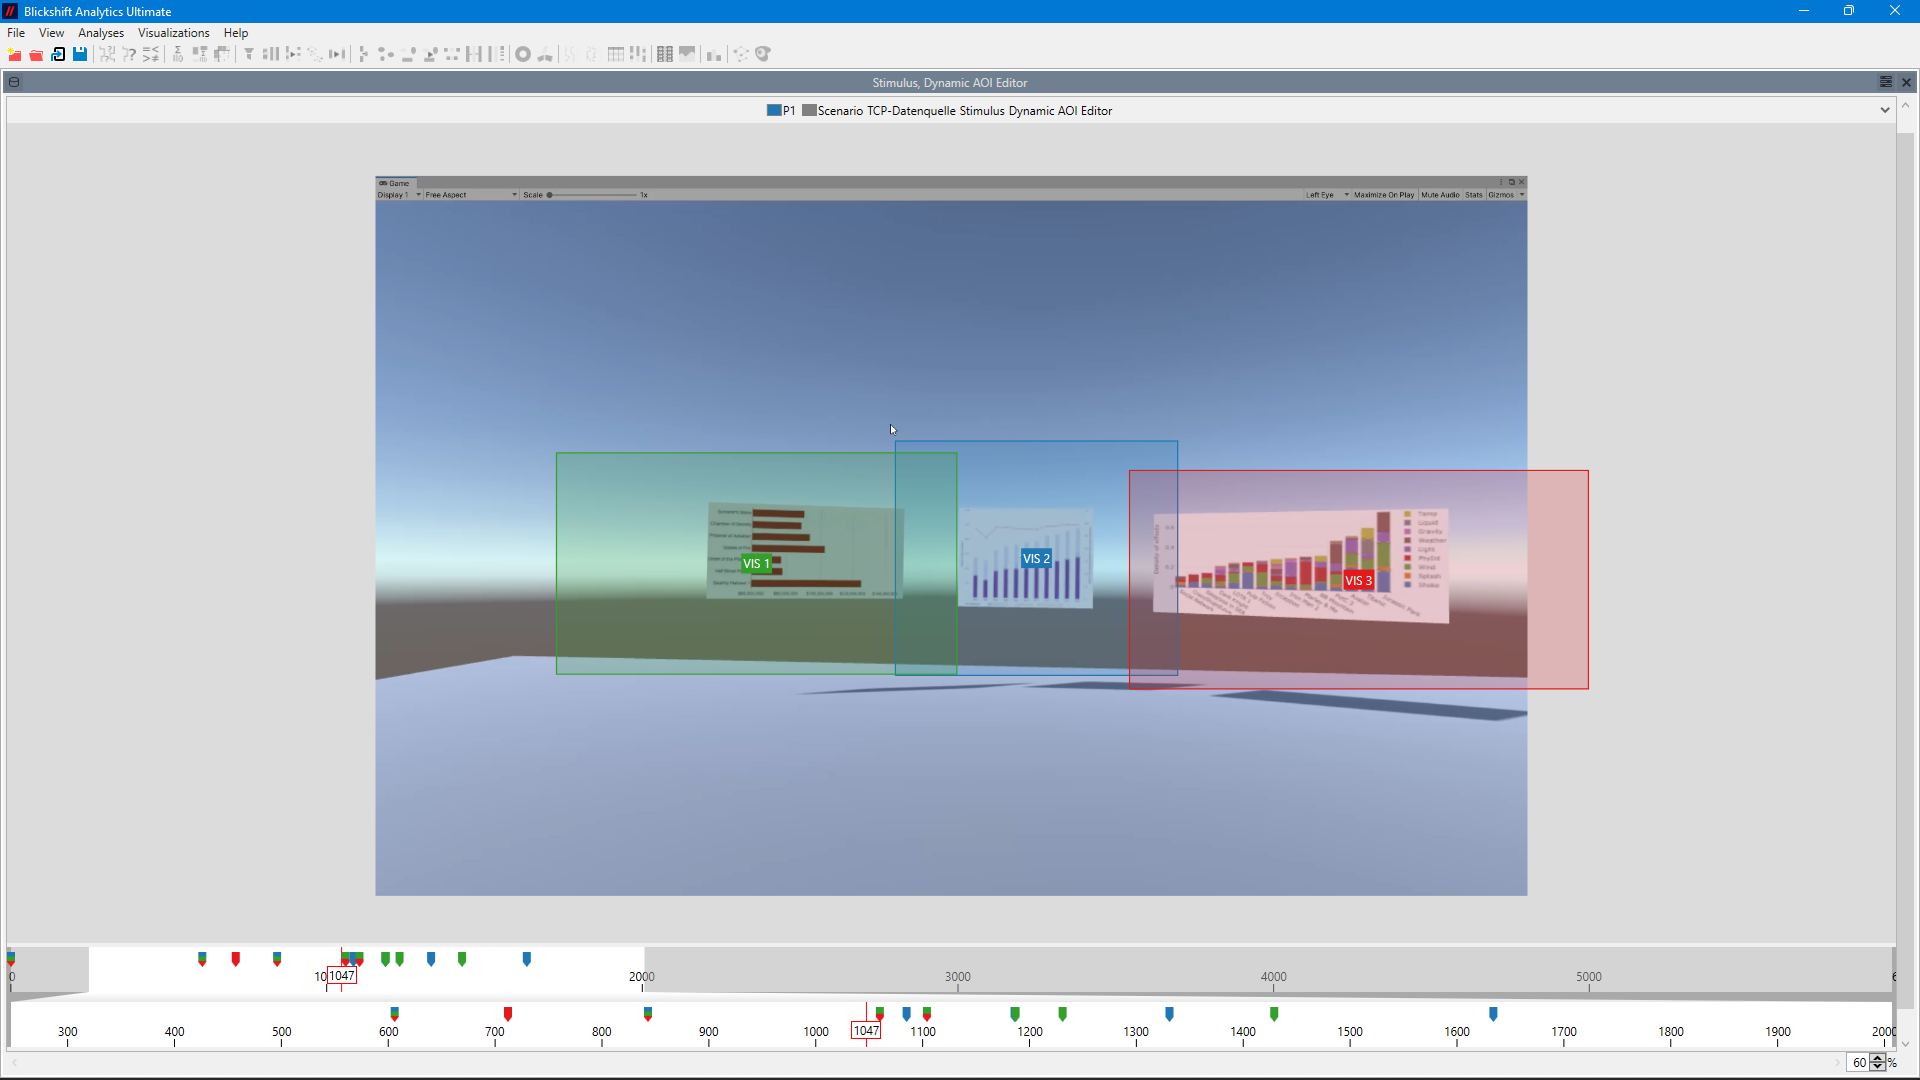 Sometimes object information is not accessible in a VR scene. Then, you can cover interesting virtual objects with the new AOI editor.
Once you have defined your dynamic areas of interest, the data will be automatically aggregated, and you will have a very efficient tool to prepare your data analysis.
If you are interested in learning more about this feature with various use cases for dynamic AOIs, please watch our YouTube video and click on the following link:
![]()
New Gaze Statistics node
The new GAZE DURATION STATISTIC feature is finally here! The gaze duration statistics node calculates some statistics about gaze on AOIs Thus, it presupposes the existence of AOI data or other enumerable columns.
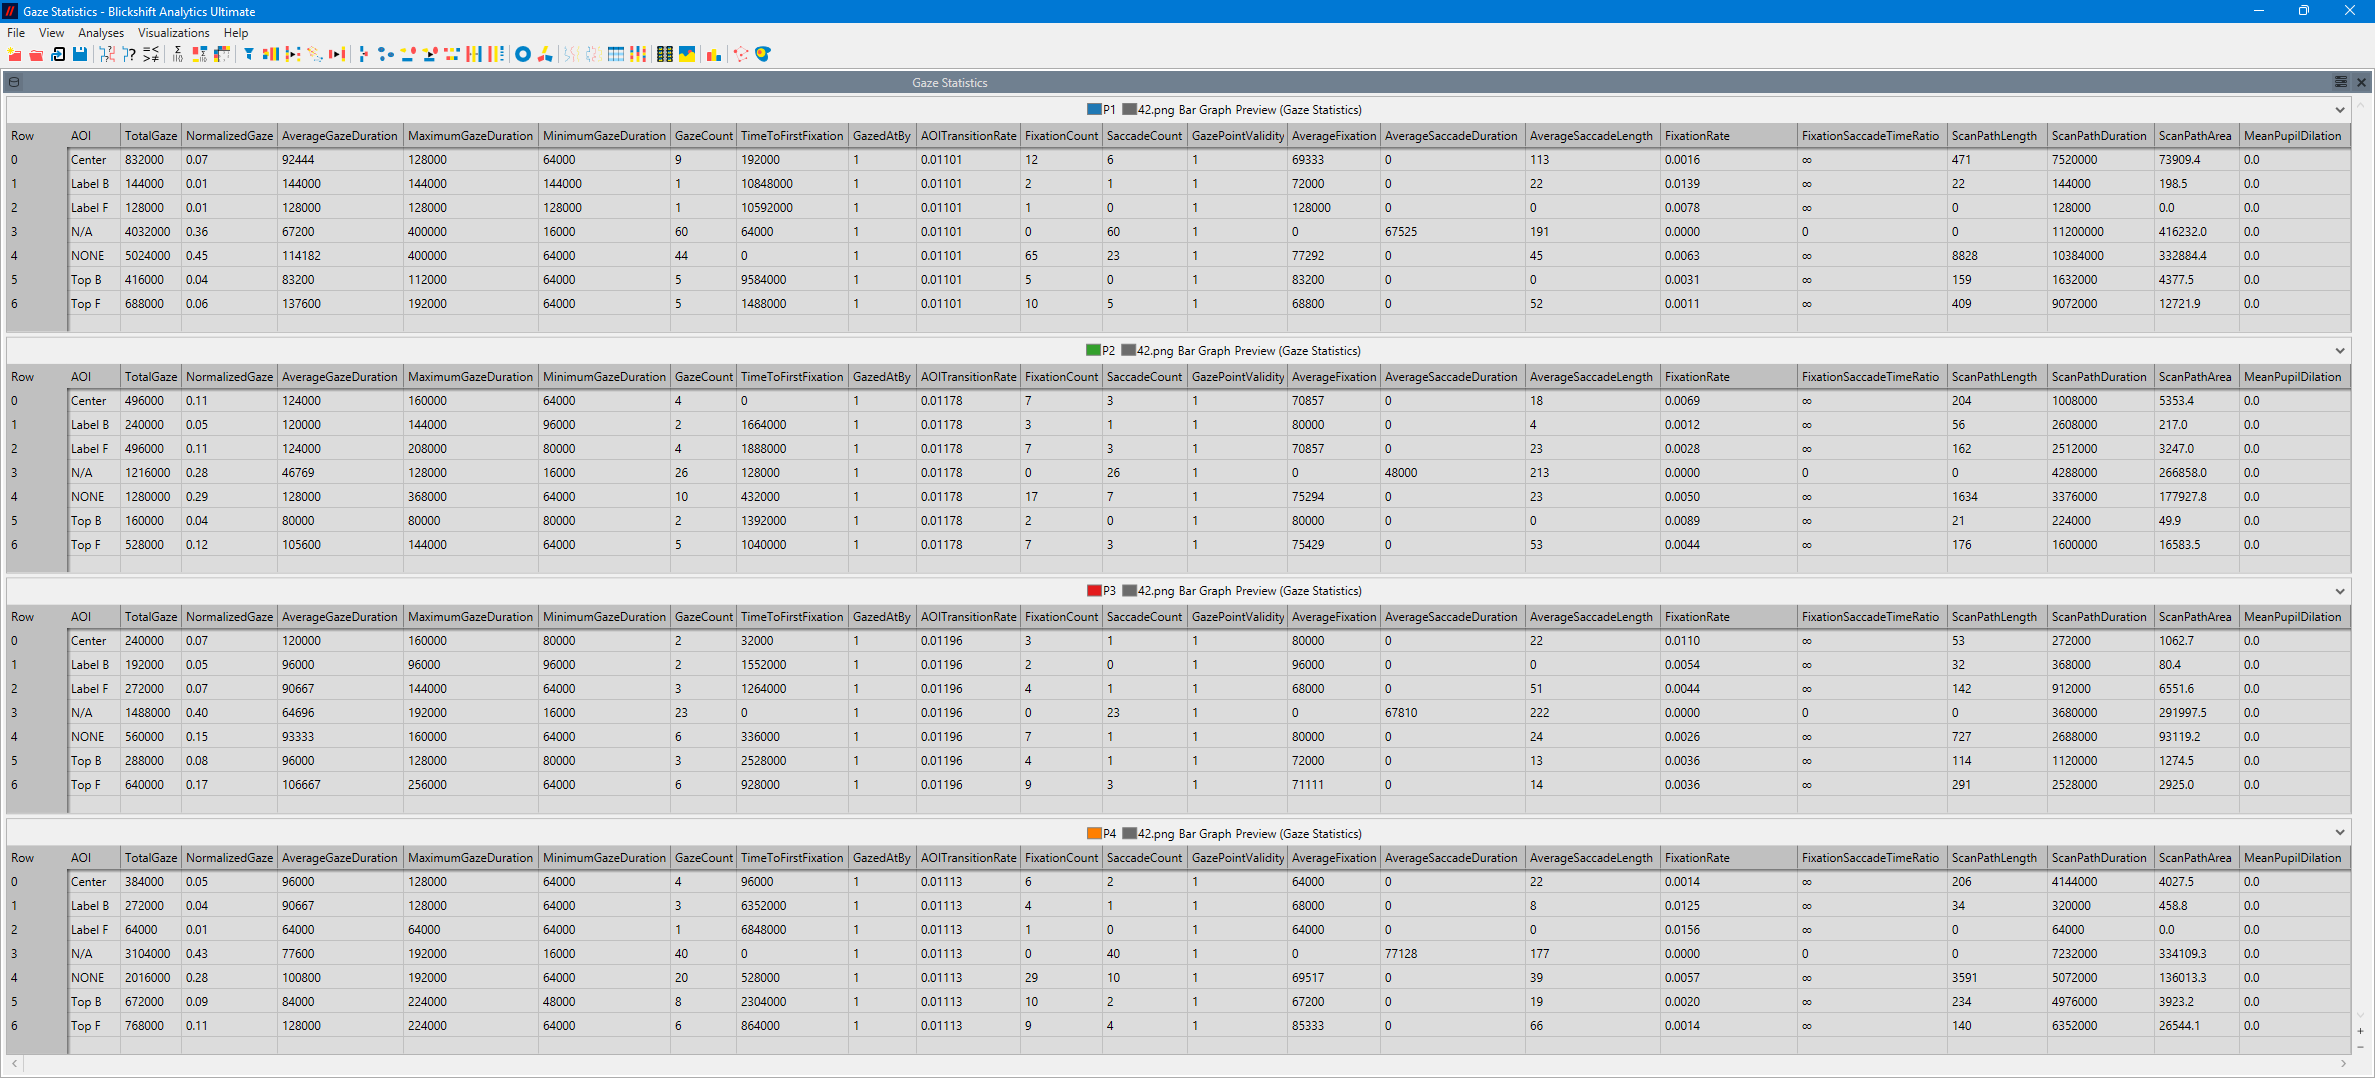
This feature makes your statistics calculation much easier and more effective, as it calculates many other metrics, such as
- AOI Transition Rate: The rate of transitions over the complete view time.
- Fixation Count: Gives you the number of fixation points within the area of interest.
- Saccade Count: Gives you the number of saccade points within the area of interest.
- Gaze Point Validity: The share of gaze points that contain valid data.
- Mean Pupil Dilation: The sum of all pupil dilations is divided by the number of all pupil dilations (per AOI).
- Average Fixation Duration: The total fixation time is divided by the number of fixations (per AOI).
- Average Saccade Duration: The total saccade time divided by the number of saccades (per AOI).
- Average Saccade Length: The total length of saccades is divided by the number of saccades (per AOI).
- Fixation Rate: The number of fixations is divided by the scan path duration (per AOI), measured in Hertz.
- Fixation Saccade Time Ratio: The total time of all fixations is divided by the total time of all saccades (per AOI).
- Scan Path Length: The sum of all distances between fixations plus the sum of the lengths of smooth pursuits.
- Scan Path Duration: The difference between the end time of the last gaze pattern (i.e. fixation, saccade, or smooth pursuit) in the specific AOI and the start time of the first gaze pattern in the specific AOI.
- Scan Path Area: The area of the bounding box that contains all fixation and saccade locations in the specific AOI.
You can read and extract all these metrics into a CSV file and calculate your further analysis in a much simpler way. If you want to summarize this data in the form of diagrams rather than tables, you can also do that with our new feature.
So, now, what are you waiting for? Please contact us and use this new feature to enjoy your analysis in a more favourable way.
If you want to learn more about this feature, please watch our YouTube video and click on the following link:
![]()