Project results: Efficient analysis of a large eye tracking experiment
- Detailed analysis of 54 data sets in a few days
- Data preparation with Blickshift Analytics
- Search for common eye movement patterns in data from pedestrians and cyclists
Blickshift Analytics has been used in a research project at the Institute for ubiquitous mobility systems of the Karlsruhe University to analyze the differences in gaze behavior from pedestrians and cyclists in real traffic. The results have been presented at the worlds’ leading eye tracking conference ETRA in June 2018 in Warsaw.
Two main challenges during the data analysis have been perfectly solved by using Blickshift Analytics:
- During the experiments large multi modal data with eye tracking, videos and accelerometer information was recorded and had to be analyzed
- Common eye movement patterns over 27 participants were found to better understand the human perception of traffic
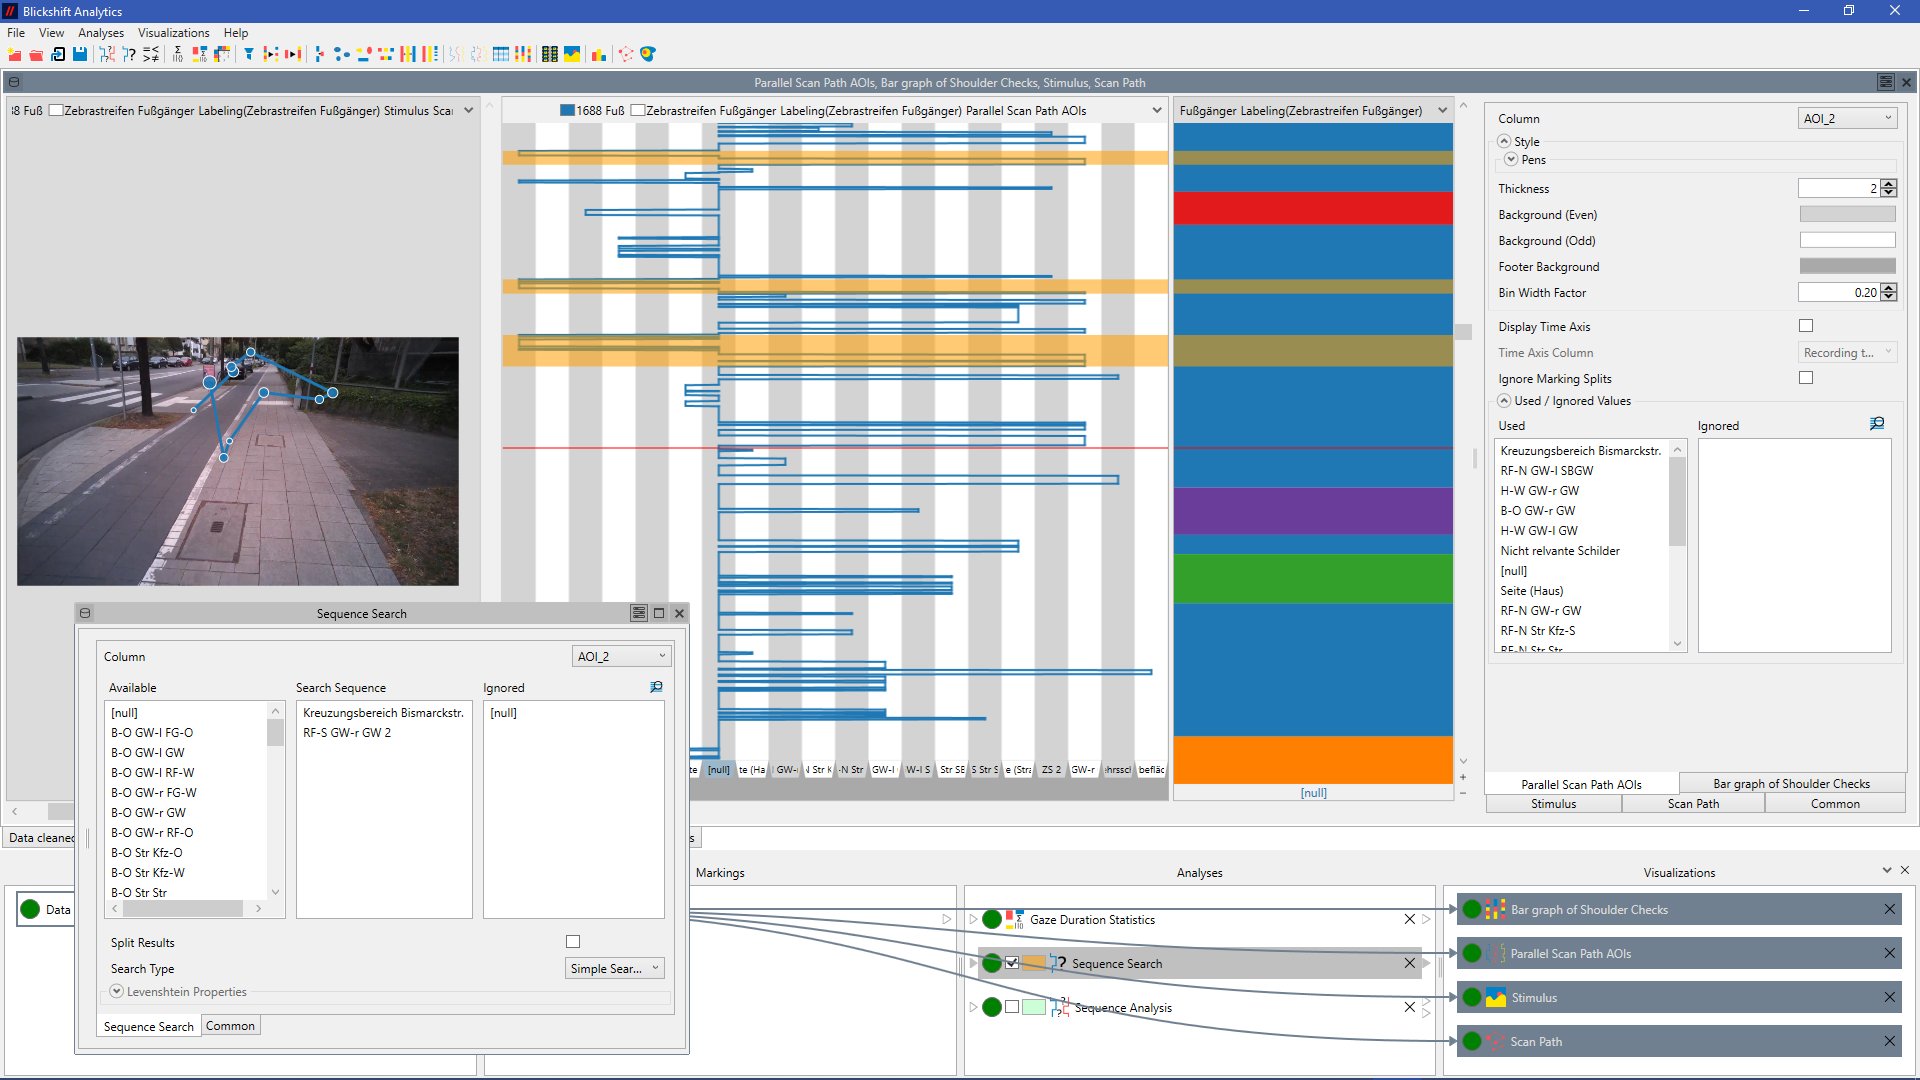
Figure 1: Efficient analysis of a large eye tracking experiment with 27 cyclists and 27 pedestrians with Blickshift Analytics.
The project consisted of three parts:
- Design and performance of a user experiment with a large number of cyclists and pedestrians in a real traffic situation
- data preparation with Blickshift Analytics
- data analysis with Blickshift Analytics
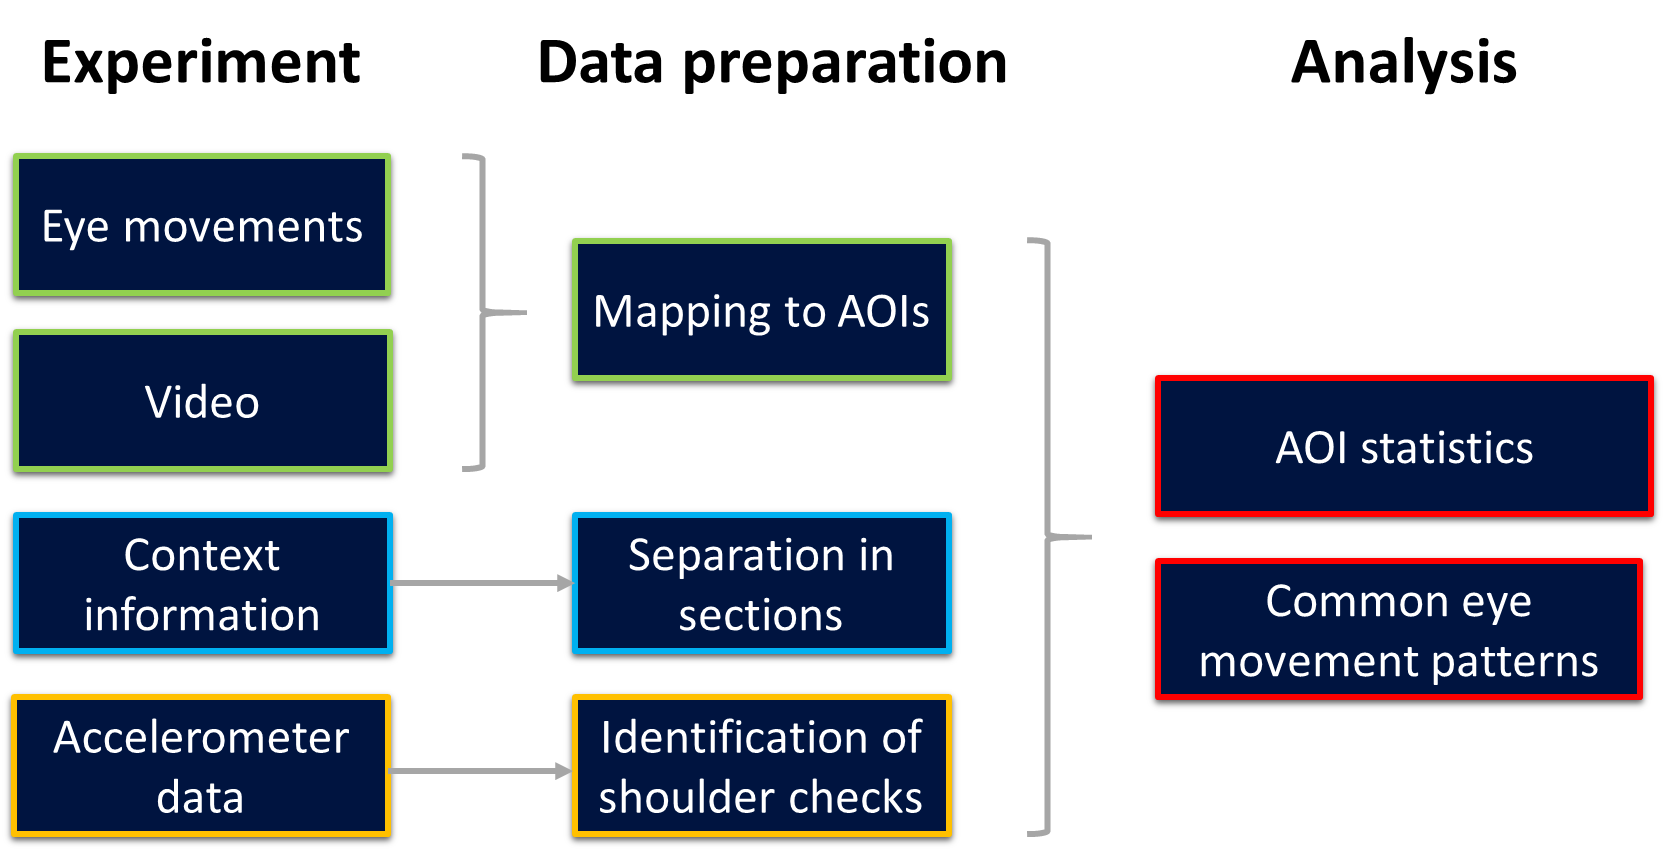
Figure 2: The project at Karlsruhe University consisted of three parts: design and performance of an eye tracking experiment in real traffic, data preparation, and analysis.
Experiment
To investigate behavior of pedestrians and cyclists, an experiment was conducted, in which participants had to follow a predefined route in an urban area of Karlsruhe in Germany, see Figure 3 left. Participants had to cycle and walk the route. The experiment was performed with 27 participants in total. For recording the eye movements, head mounted video and accelerometer data, the Tobii Pro Glasses 2 system has been used. The context information was generated based on the video stream for each participant. In total, 54 data sets have been recorded. This data leads to the challenge, that in total more than 150.000 fixations had to be analyzed!
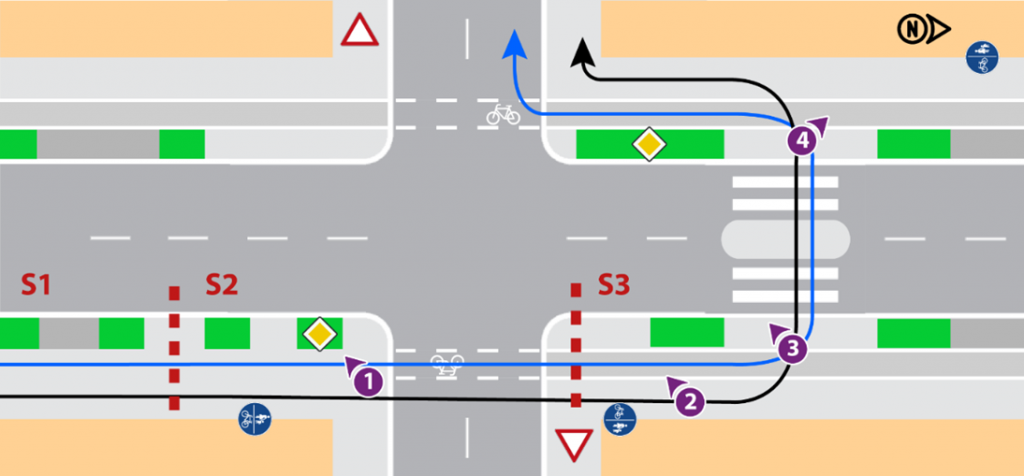
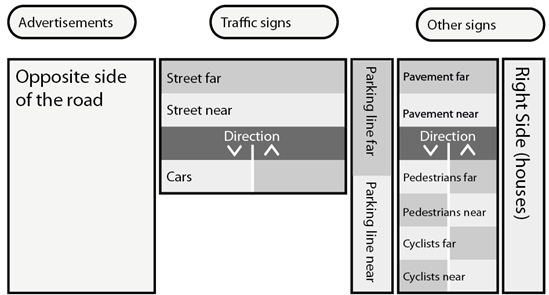
Figure 3: Section of the predefined route in Karlsruhe, example of a pedestrian crossing (left), reference map for the annoation of AOIs (right).
Data preparation
Because of the complex traffic environment, an abstract reference image of the scene to define AOIs has been used, see Figure 3 right. Since there was no automatic mapping algorithm available in 2017, that was working with a high mapping quality for eye movement data from traffic situations, fixations had to be mapped manually to this reference images. For this reason, only a a selection of traffic situations has been taken into account.
In contrast, shoulder checks could have been identified automatically by using the Value Search component of Blickshift Analytics. In traffic, performing shoulder checks before switching lanes or turning is important to avoid accidents. Because such eye movements occur fast fixations are missing. Figure 4 shows a plot of the accelerometer data. Figure 4 left depicts the x-direction of the accelerometer sensor, second from left the y-direction (representing gravity), and third from left represents the z-direction. Figure 4 right shows the current frame of the video recording. A spike in these graphs indicates a rapid change of the acceleration. With a combination of the Value Search and Labeling component in Blickshift Analytics, each instance of a shoulder check was labeled by simply searching for the pattern x-direction ≤ 0 and the z-direction ≥ 0.
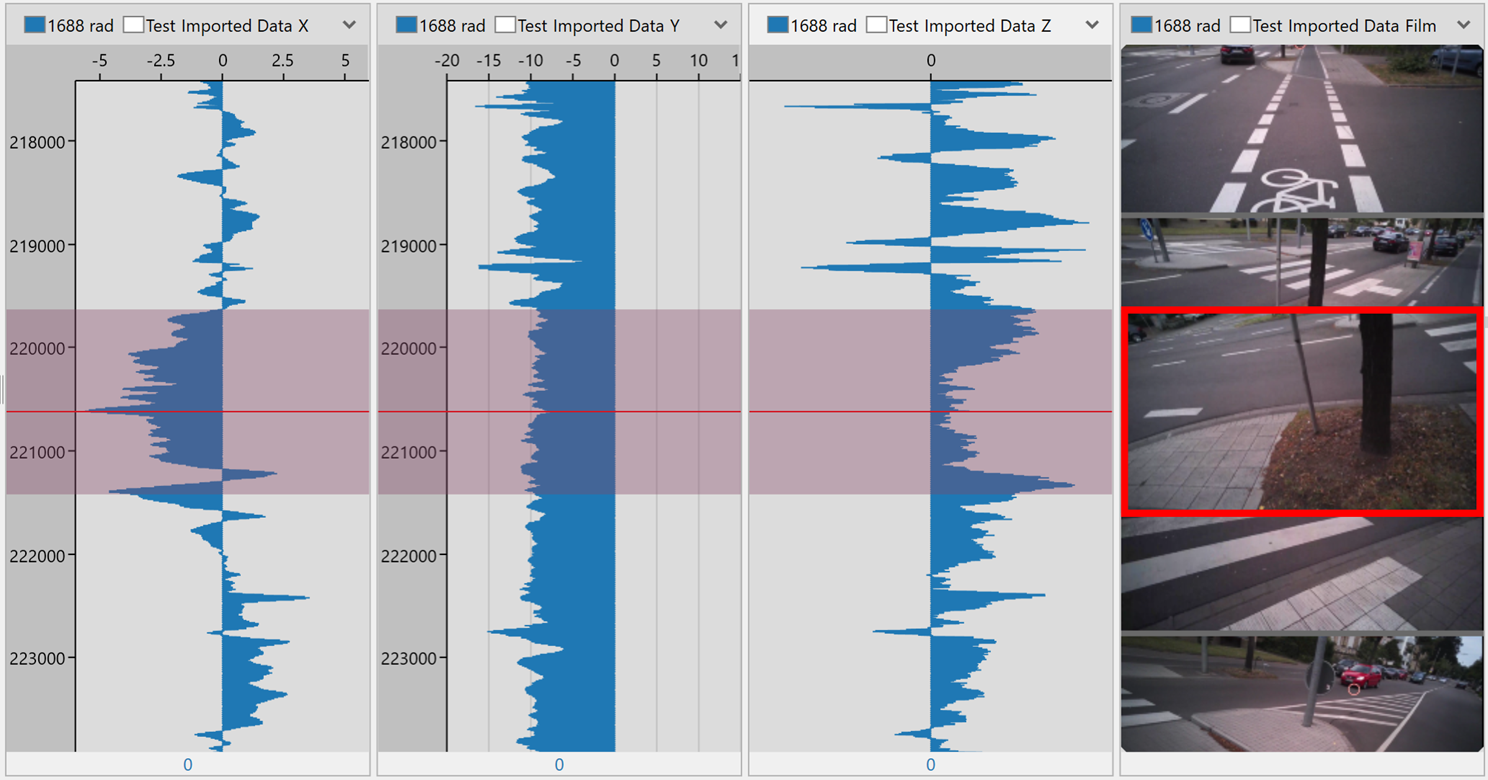
Figure 4: Visualization of the accelerometer data in Blickshift Analytics for detecting of shoulder checks.
Data analysis
For a deep analysis of eye movement sequences Blickshift Analytics provides the two components Sequence Search and Sequence Analysis. With a few mouse clicks, several common eye movement strategies could be found for pedestrians and cyclists, see Figure 5. Additionally, the Value Search component applied on the accelerometer data stream has shown that cyclists performed less shoulder checks. Further, important shoulder checks have not been performed in critical traffic situations.
After data preparation, the final analysis of the 54 data sets took only two days.
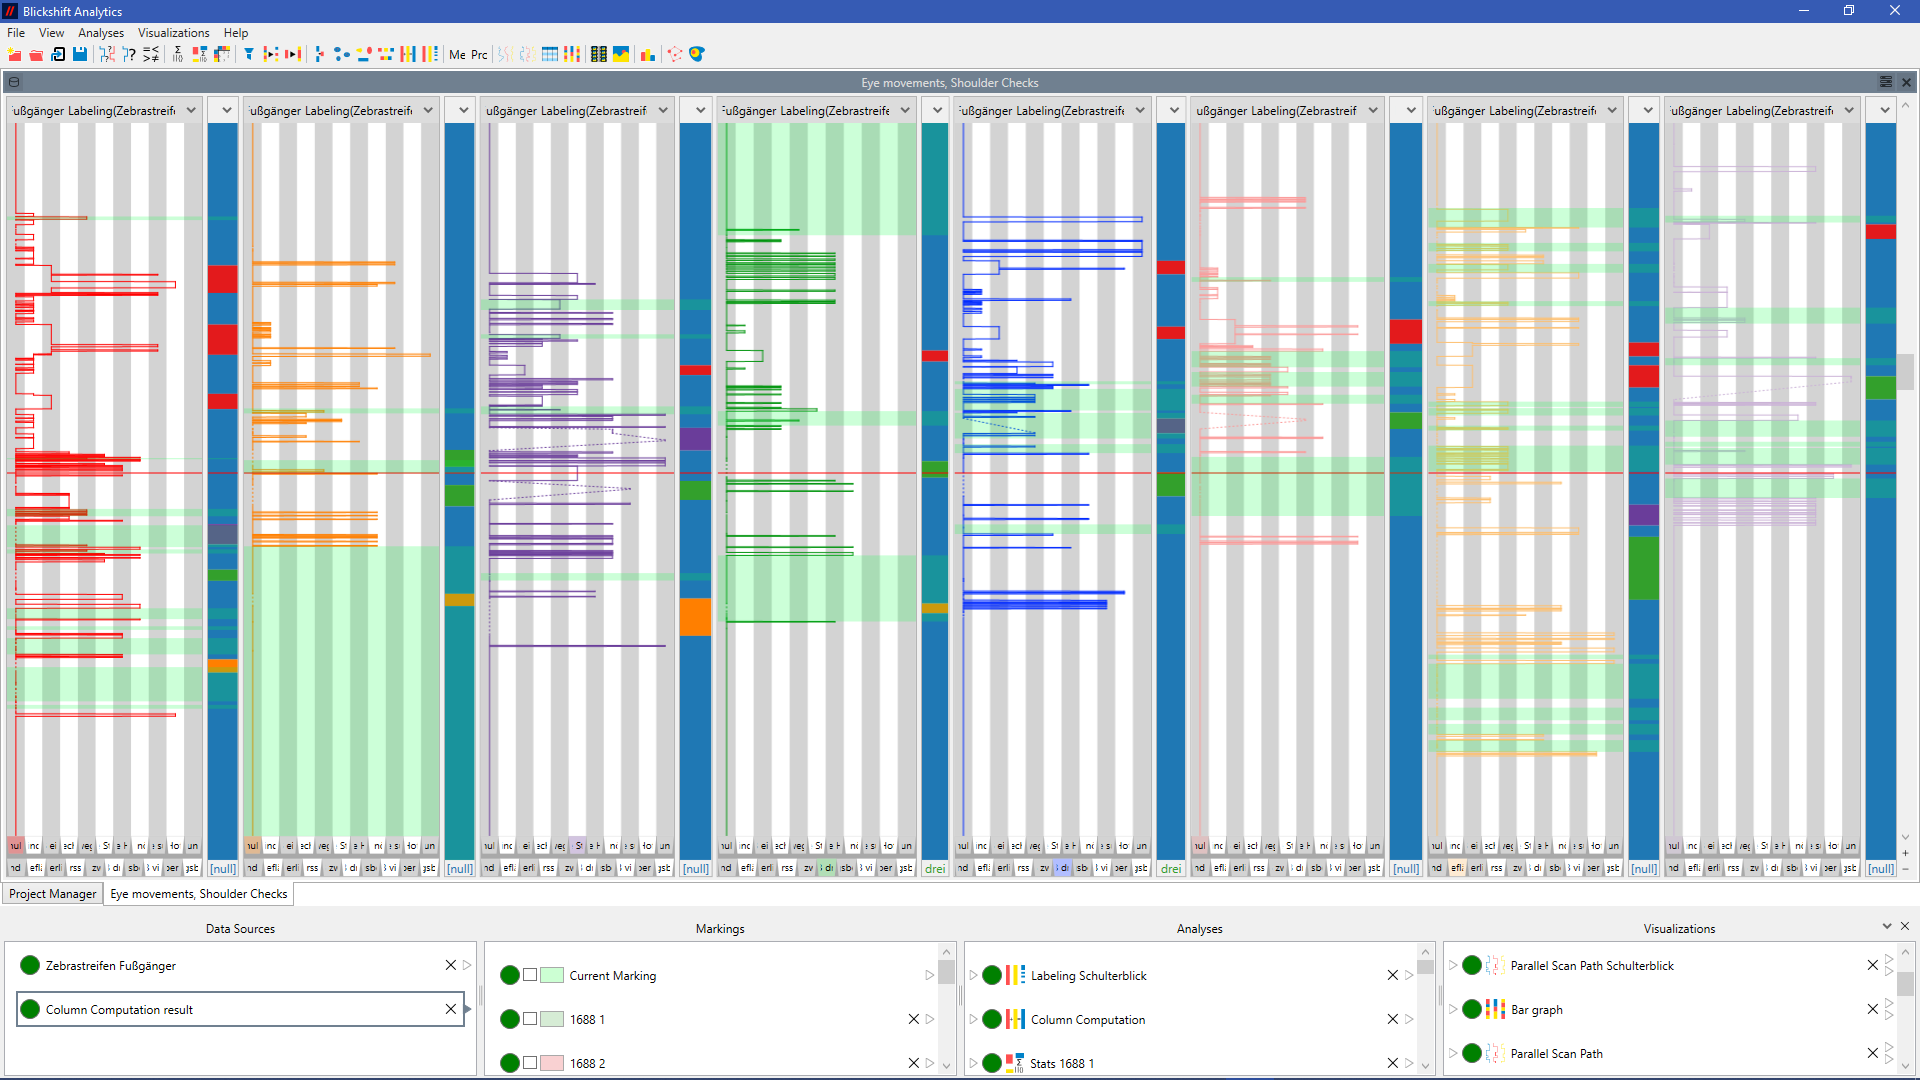
Figure 5: Deep data analysis of eye movements. Common eye movement patterns are highlighted in green.
Scientific publication
Mathias Trefzger, Tanja Blascheck, Michael Raschke, Sarah Hausmann and Thomas Schlegel; A visual comparison of gaze behavior from pedestrians and cyclists; Proceedings of the 2018 ACM Symposium on Eye Tracking Research and Applications, ETRA 2018, Warsaw, Poland, June 14-17, 2018.
Client

The Institute for ubiquitous mobility systems at the Karlsruhe University works in the scientific fields of mobility systems and ubiquitous computing, especially at the interface between interaction and models in ubiquitous systems. The expertise lays in in ubiquitous, distributed systems, in human-machine interaction and usability of ubiquitous systems, modeling of complex systems and processes for adaptive systems.