Analyzing eye-tracking data in Virtual and Augmented Reality environments is one of the most complex tasks in modern research. In immersive 3D worlds, both the user and the objects move dynamically, making it difficult to define and track Areas of Interest (AOIs) over time. Blickshift Recorder solves this challenge by capturing eye movements and all relevant log data directly from the VR environment through a dedicated script in Unreal or Unity. This ensures that gaze data, head movements, and scene events are perfectly synchronized at every moment of the experiment.
Once recorded, all data can be explored and visualized interactively in Blickshift Analytics. Researchers can replay gaze behavior within the 3D context and analyze complex interactions between gaze direction, head motion, and scene dynamics. Even in highly dynamic setups, AOIs can be visualized precisely, giving deep insight into how users perceive and interact with virtual objects.
Unlike other tools, Blickshift Analytics scales effortlessly with large datasets, allowing smooth visualization and analysis even for long or data-intensive VR sessions.
Visual attention across 360° environments with replay
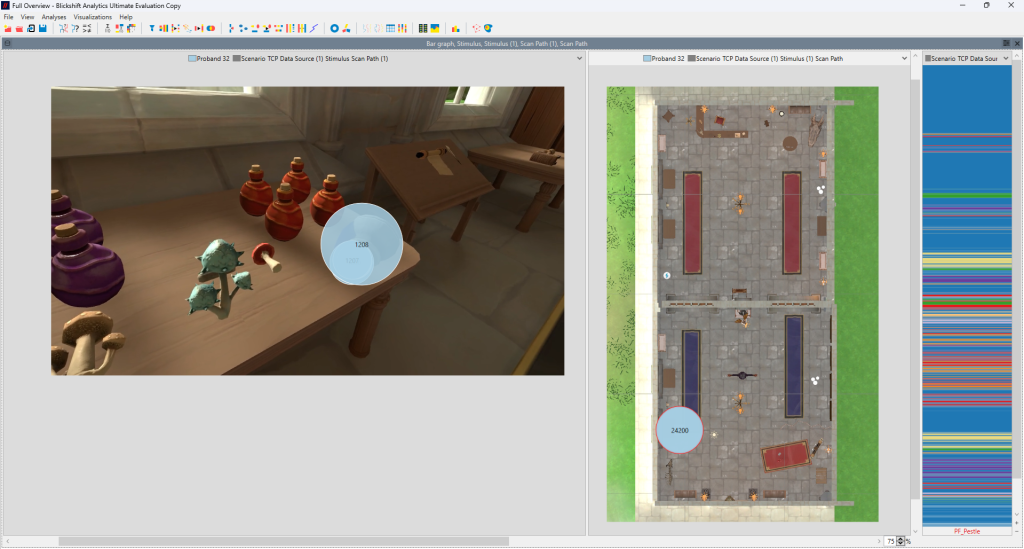
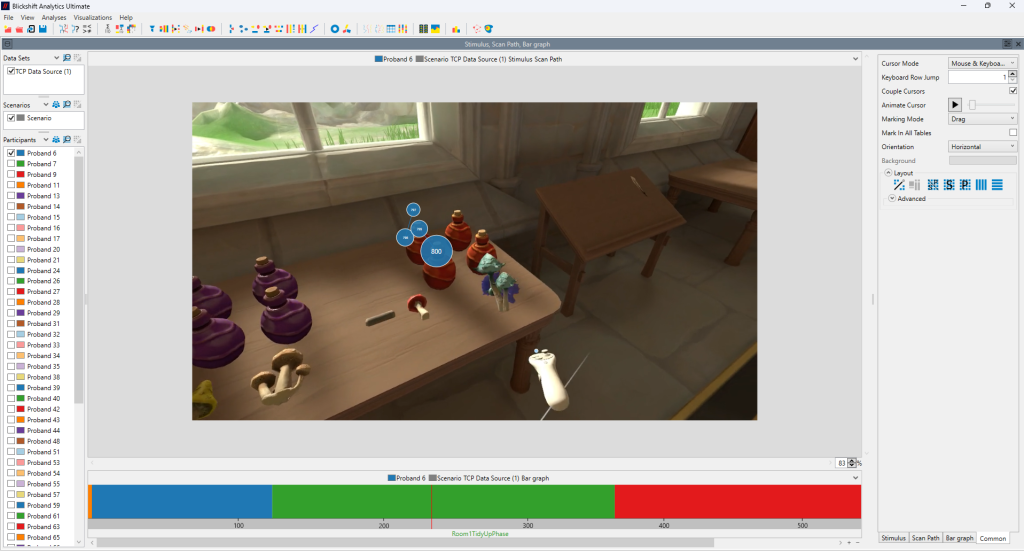
Challenge: Understanding user behavior in 3D.
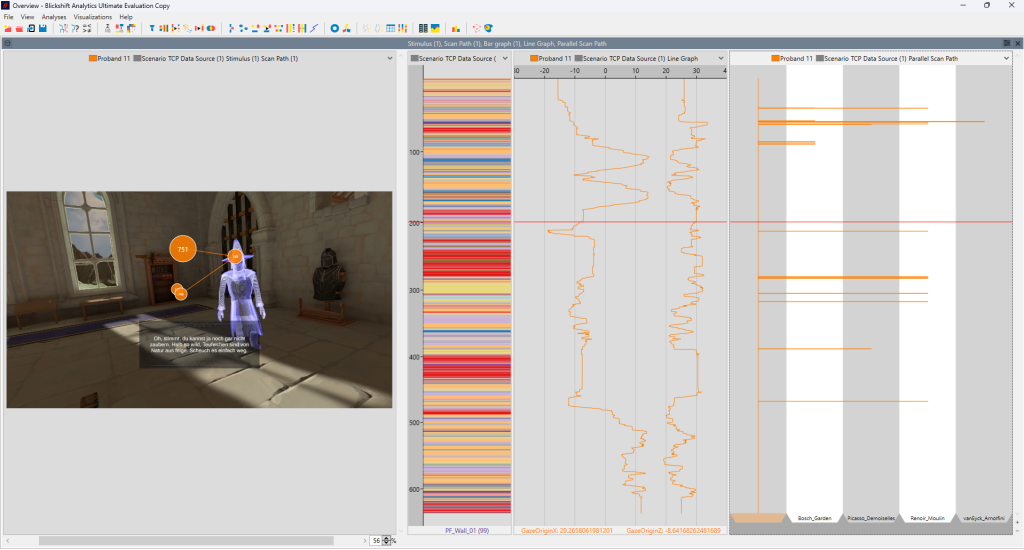
- Imagine gaining a detailed overview of user behavior in a 3D environment with just four mouse clicks. By combining a scan path visualization with a dynamic bar graph, Blickshift Analytics delivers an interactive replay that shows both the overall situation and the user’s ego perspective, complete with precise eye-movement data. This provides researchers with an intuitive and comprehensive understanding of how users explore and perceive immersive virtual worlds.
Multimodal data analysis without any compromises
Challenge: Analyzing eye-tracking data in VR and AR is challenging because it requires combining complex information to truly understand the user’s cognitive and perceptual state.
- Everything starts with our advanced interactive visualizations of eye-tracking data, allowing researchers to explore gaze behavior in detail. Alongside eye movements, the software presents logged information such as user positions in the virtual world, object interactions, controller states, and data from other players or AI-controlled entities. This integrated visualization delivers a holistic understanding of the participant’s cognitive and perceptual state during VR experiments. The insights gained enable researchers and developers to make data-driven usability decisions and design more immersive, intuitive user experiences based on quantitative evidence.
Data recording in VR and AR made simple
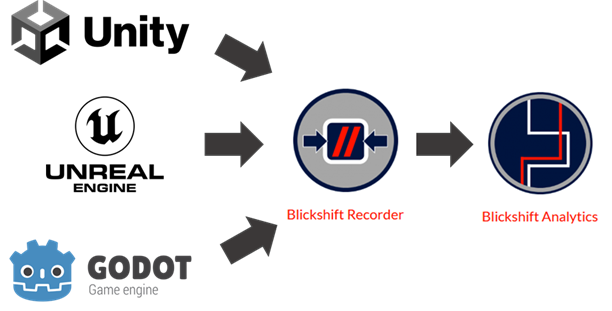
Challenge: Recording synchronized and complete eye-tracking and interaction data in complex 3D VR or AR environments is challenging.
- To make eye movement and interaction log recording as simple as possible, Blickshift provides an easy-to-use connection between the virtual world and the subsequent data analysis. The key tool for this is Blickshift Recorder, which integrates with plugins for all major 3D development environments and captures user interactions in real time. Blickshift Recorder manages the recording and precise time synchronization of all data streams, ensuring perfectly aligned datasets. The recorded data can then be directly imported into Blickshift Analytics for detailed and efficient analysis.
Pinpoint critical VR hotspots with AOI precision
Challenge: Defining and analyzing Areas of Interest (AOIs) in VR and AR is far from trivial.
- Using the data provided directly through the Blickshift Recorder interface to the 3D runtime, Blickshift Analytics enables you to manage AOI information with exceptional flexibility. AOIs can be generated automatically from object information within the 3D world and later aggregated or adapted to your specific research questions, without any additional coding effort.
- With just a few clicks, Blickshift Analytics calculates up to 20 standard eye-tracking metrics and visualizes them intuitively within the software. This end-to-end workflow supports your entire 3D eye-tracking data analysis process, from recording to interpretation, making complex VR/AR studies efficient, transparent, and reproducible.
All important statistics with a single mouse click
Challenge: Calculating statistics metrics about eye movements is an essential tool during an eye tracking analysis.
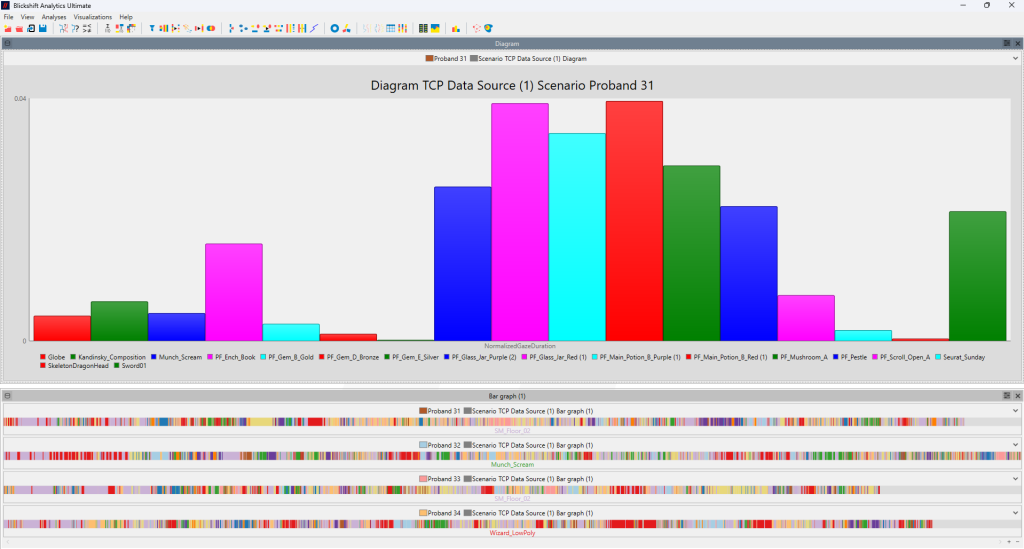
- We’ve analyzed what metrics most eye tracking researchers are using and have implemented all of them in one single component! With Blickshift Analytics you can now compute up to 21 metrics without any implementation of code just by a mouse-click. Like computing these metrics is easy, you can simply export all these metrics in standard csv format for a further statistical analysis with the tools you are currently already using. If you want to directly visualize the statistical results this is also possible. The statistic node seemlesly works together with our diagram component. Both components are available in all edition of Blickshift Analytics together with the data exporter.
Integrating Spatial and Interaction Data
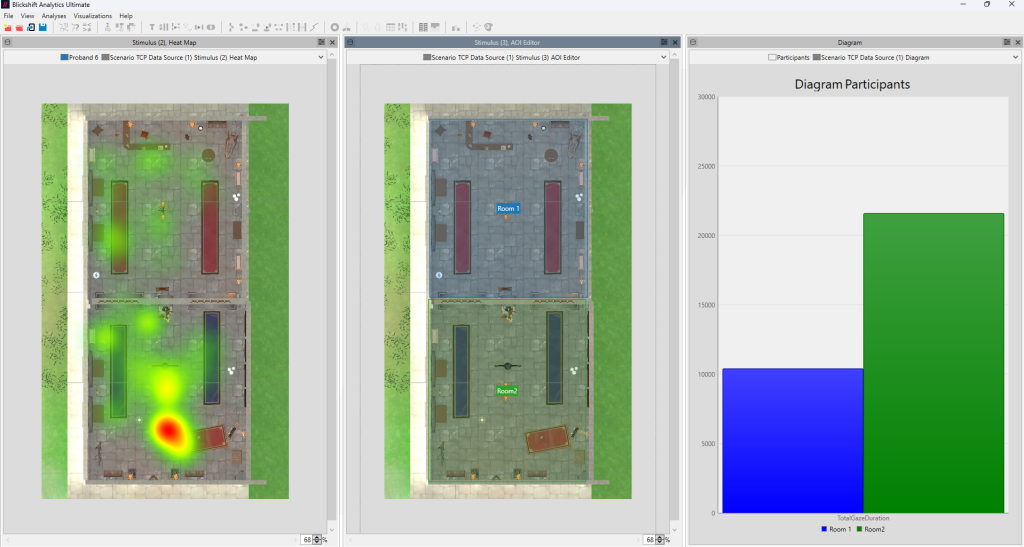
Challenge: Understanding user trajectories in 3D space.
- With Blickshift Analytics, you can go far beyond gaze data by visualizing spatial trajectories and analyzing movement behavior directly within the 3D model. The same intuitive tools used for AOI definition can be applied to spatial regions, allowing you to compute metrics such as total dwell time or movement frequency. In addition, spatial heat maps and trajectory visualizations provide deep insights into how users navigate and interact within virtual environments, giving you a complete view of human behavior in 3D space. Through combining the spatial analysis with interaction and eye movement analysis you will get a perfect understanding how spatial motion, user interactions, and cognitive processes interrelate.