Understand What Really Draws Attention on Screen: Whether you are running market research, UX studies, or cognitive experiments – Blickshift Analytics transforms raw eye tracking data into clear, actionable insights.
Our software helps you see what your users see, understand their visual decision-making, and communicate results in a way that everyone understands – from managers to data scientists.
Blickshift Analytics supports data from all major desktop systems – including Tobii, Gazepoint, and others.
You can easily import your recordings, synchronize them with screen captures or experimental events, and start exploring.
No complex preprocessing. No coding required. Just insights.
Best of all: Blickshift Analytics is compatible with eye trackers from all major manufacturers, including Tobii, EyeLogic, and GazePoint.
Powerful visualizations at your fingertips
Challenge: Eye-tracking data captures a wealth of information about visual perception, but navigating and analyzing it can be complex and time-consuming.
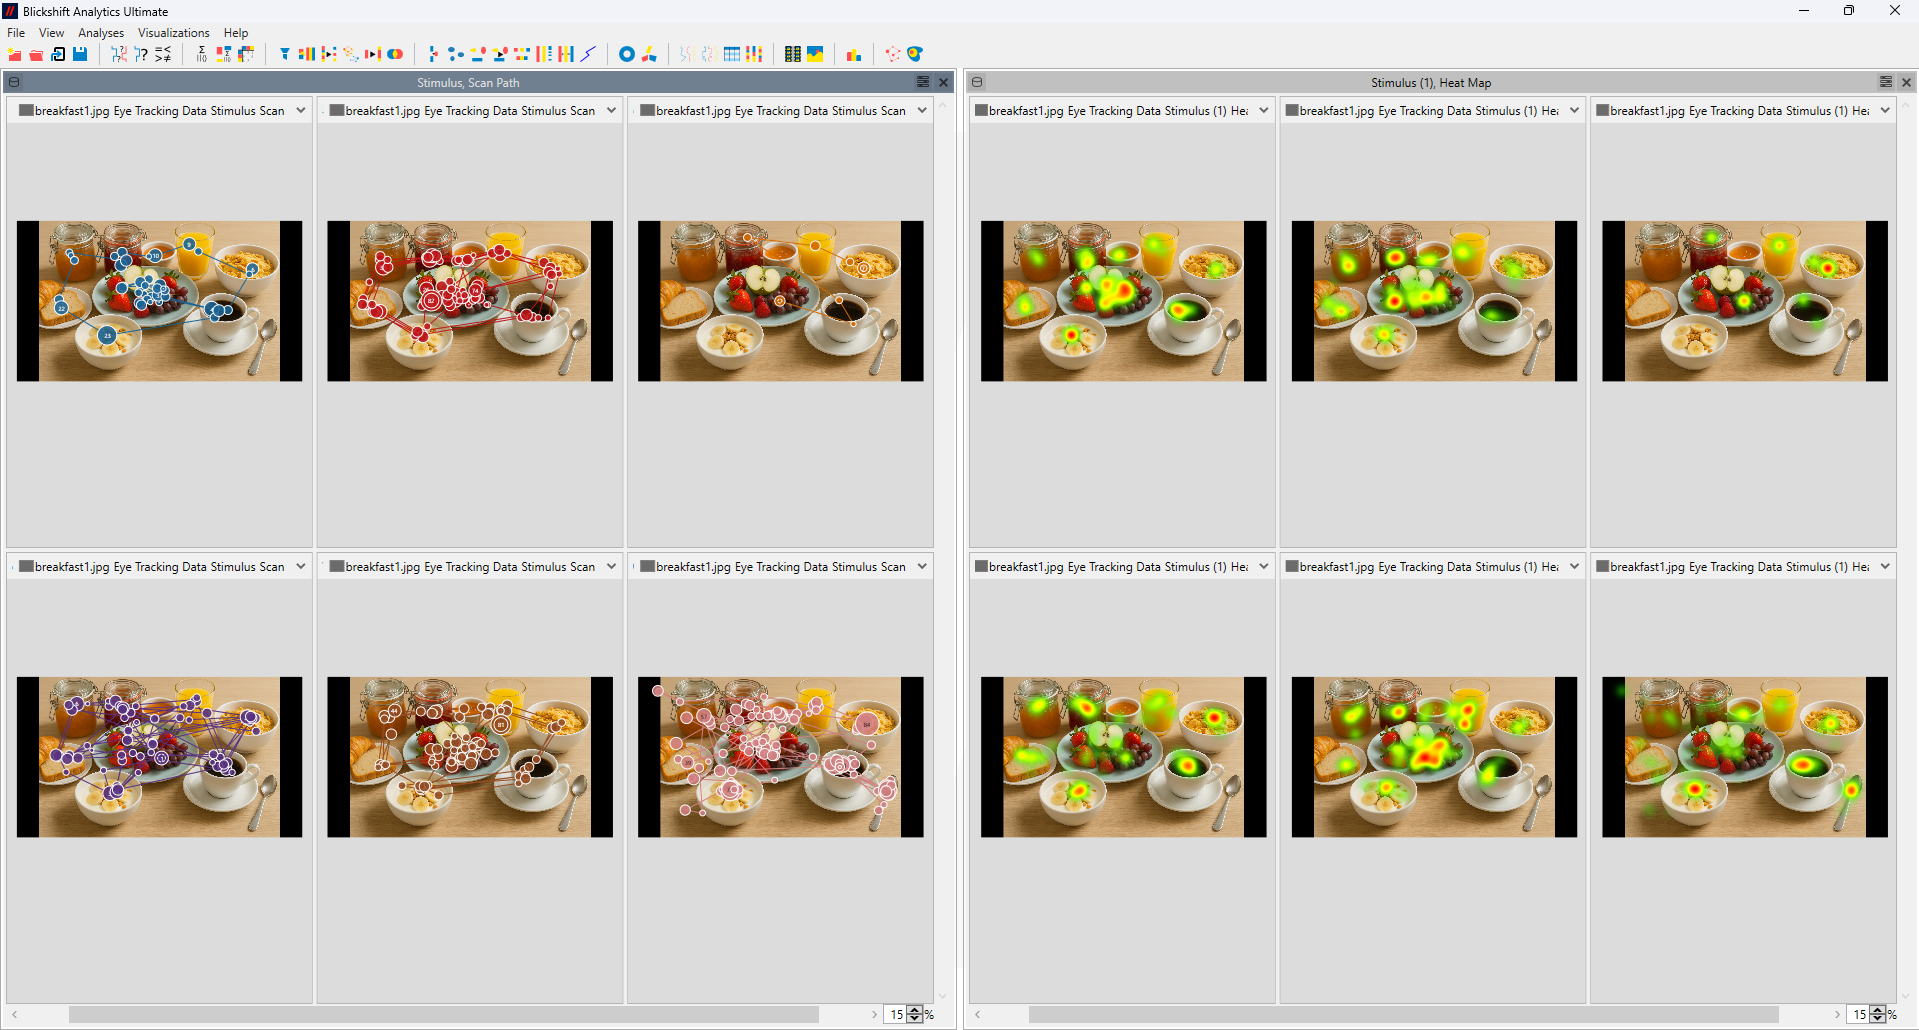
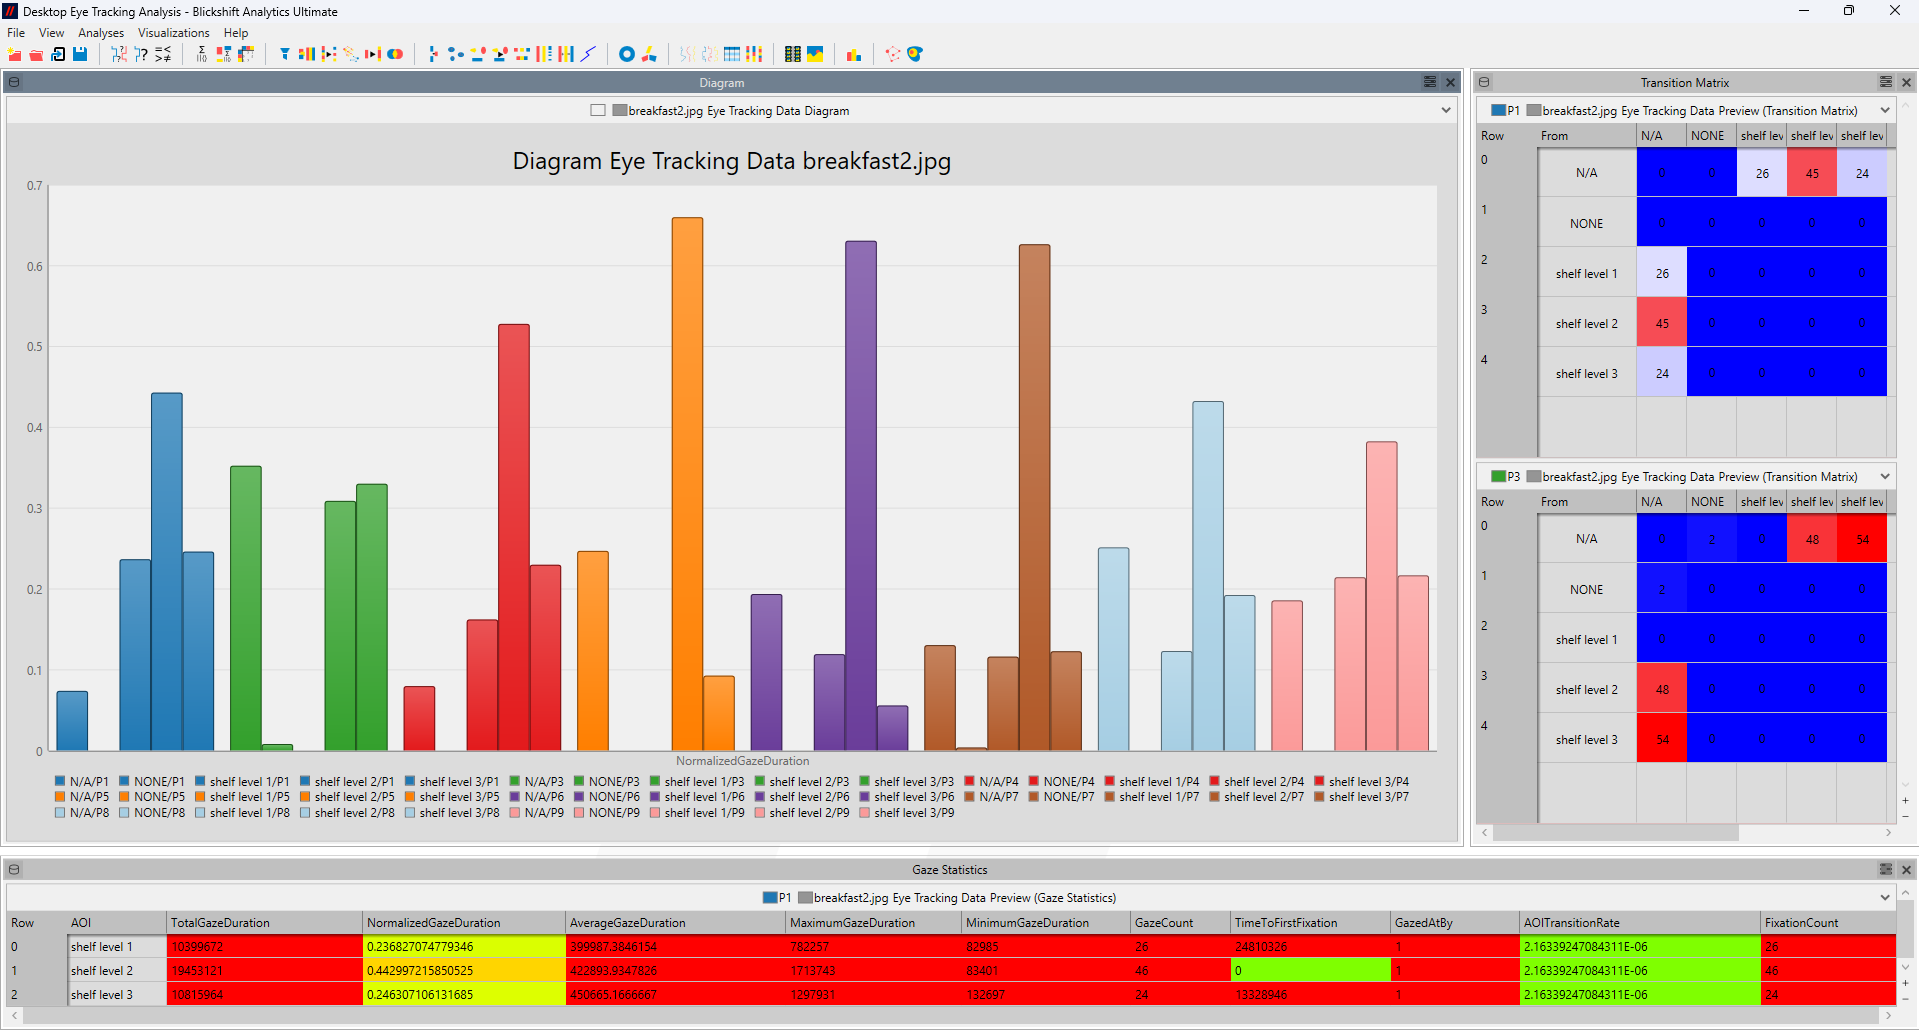
- Blickshift Analytics makes exploration effortless. From heatmaps and scanpaths to advanced modern visualizations, all insights are just a click away. Seamlessly integrate demographic or questionnaire data, aggregate results, and get a clear overview of your findings in seconds, saving you time and enabling faster, data-driven decisions.
Efficient KPI-based clustering of eye movements
Challenge: Identifying common viewing behaviors or comparing gaze patterns across groups often requires complex analysis and expert knowledge.
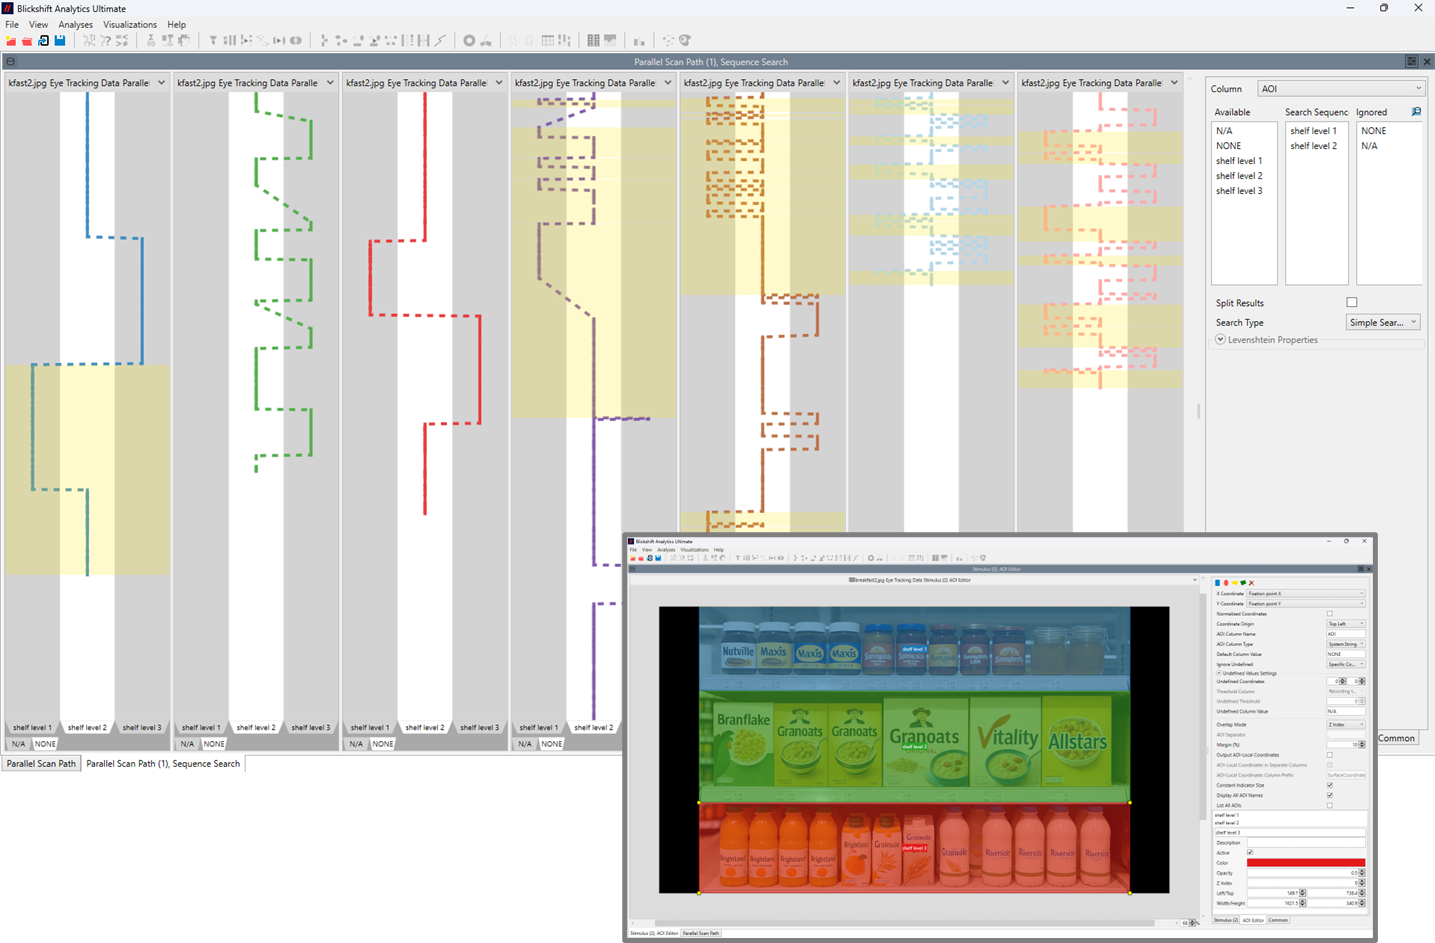
- Blickshift Analytics introduces market-unique pattern search features that make these insights effortless:
- KPI-Based Search: Define an ideal scan path, and the software finds participants who follow it (yellow sections in screenshot)
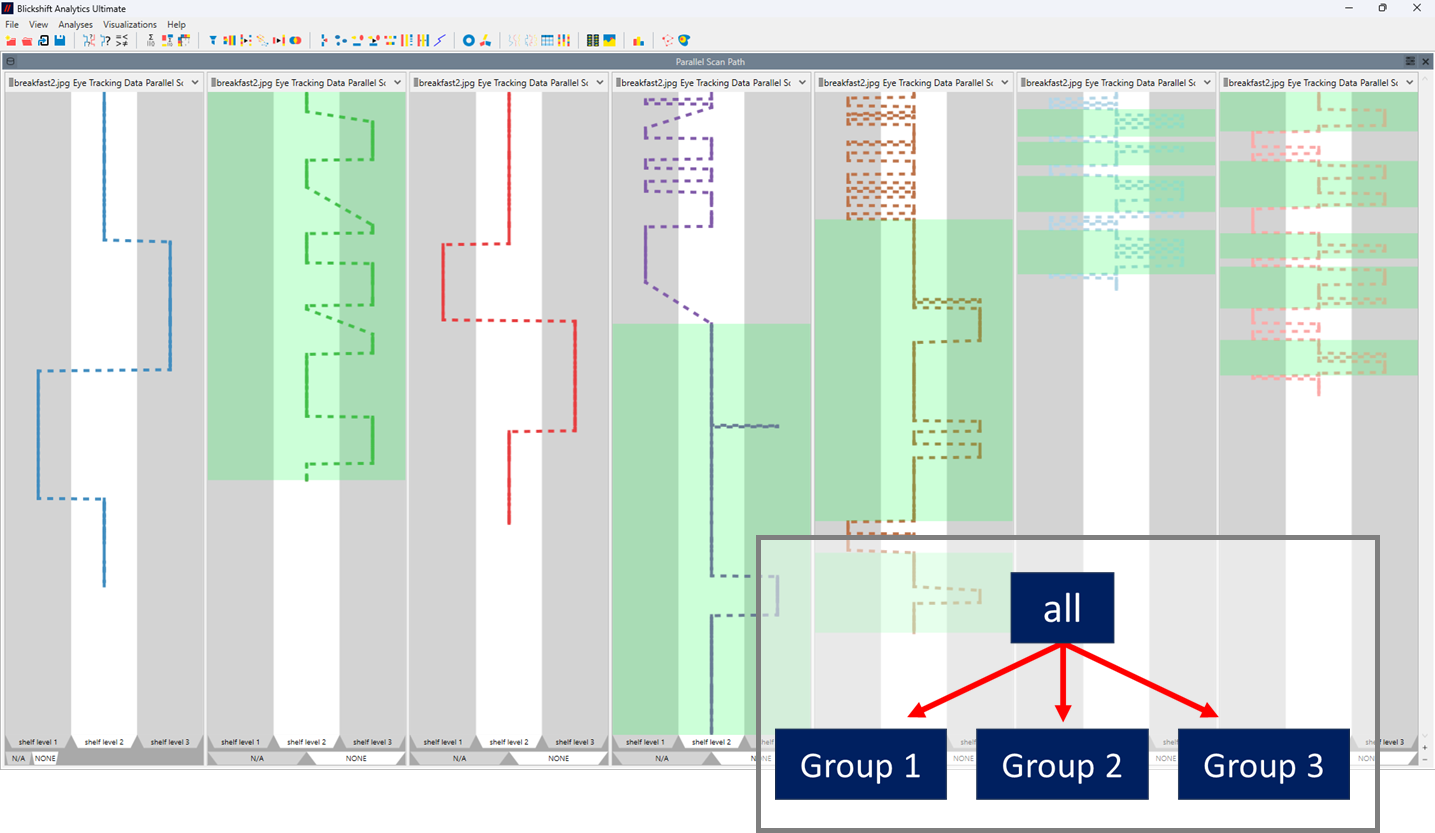
- Automatic Clustering: Discover typical eye movement patterns automatically—link them with demographic or questionnaire data to reveal meaningful correlations (green sections in screenshot)
- Spatial Scan Path Clustering: Identify groups of participants who share the same gaze behavior, making it immediately clear who perceives a stimulus in the same way
With pattern search, you can quickly uncover insights about attention and perception, speeding up analysis and enhancing your research quality.
Dynamic and precise AOI handling, even for small or moving stimuli
Challenge: In eye-tracking studies, defining and tracking areas of interest (AOIs) becomes difficult when stimuli are small or move dynamically across the screen.
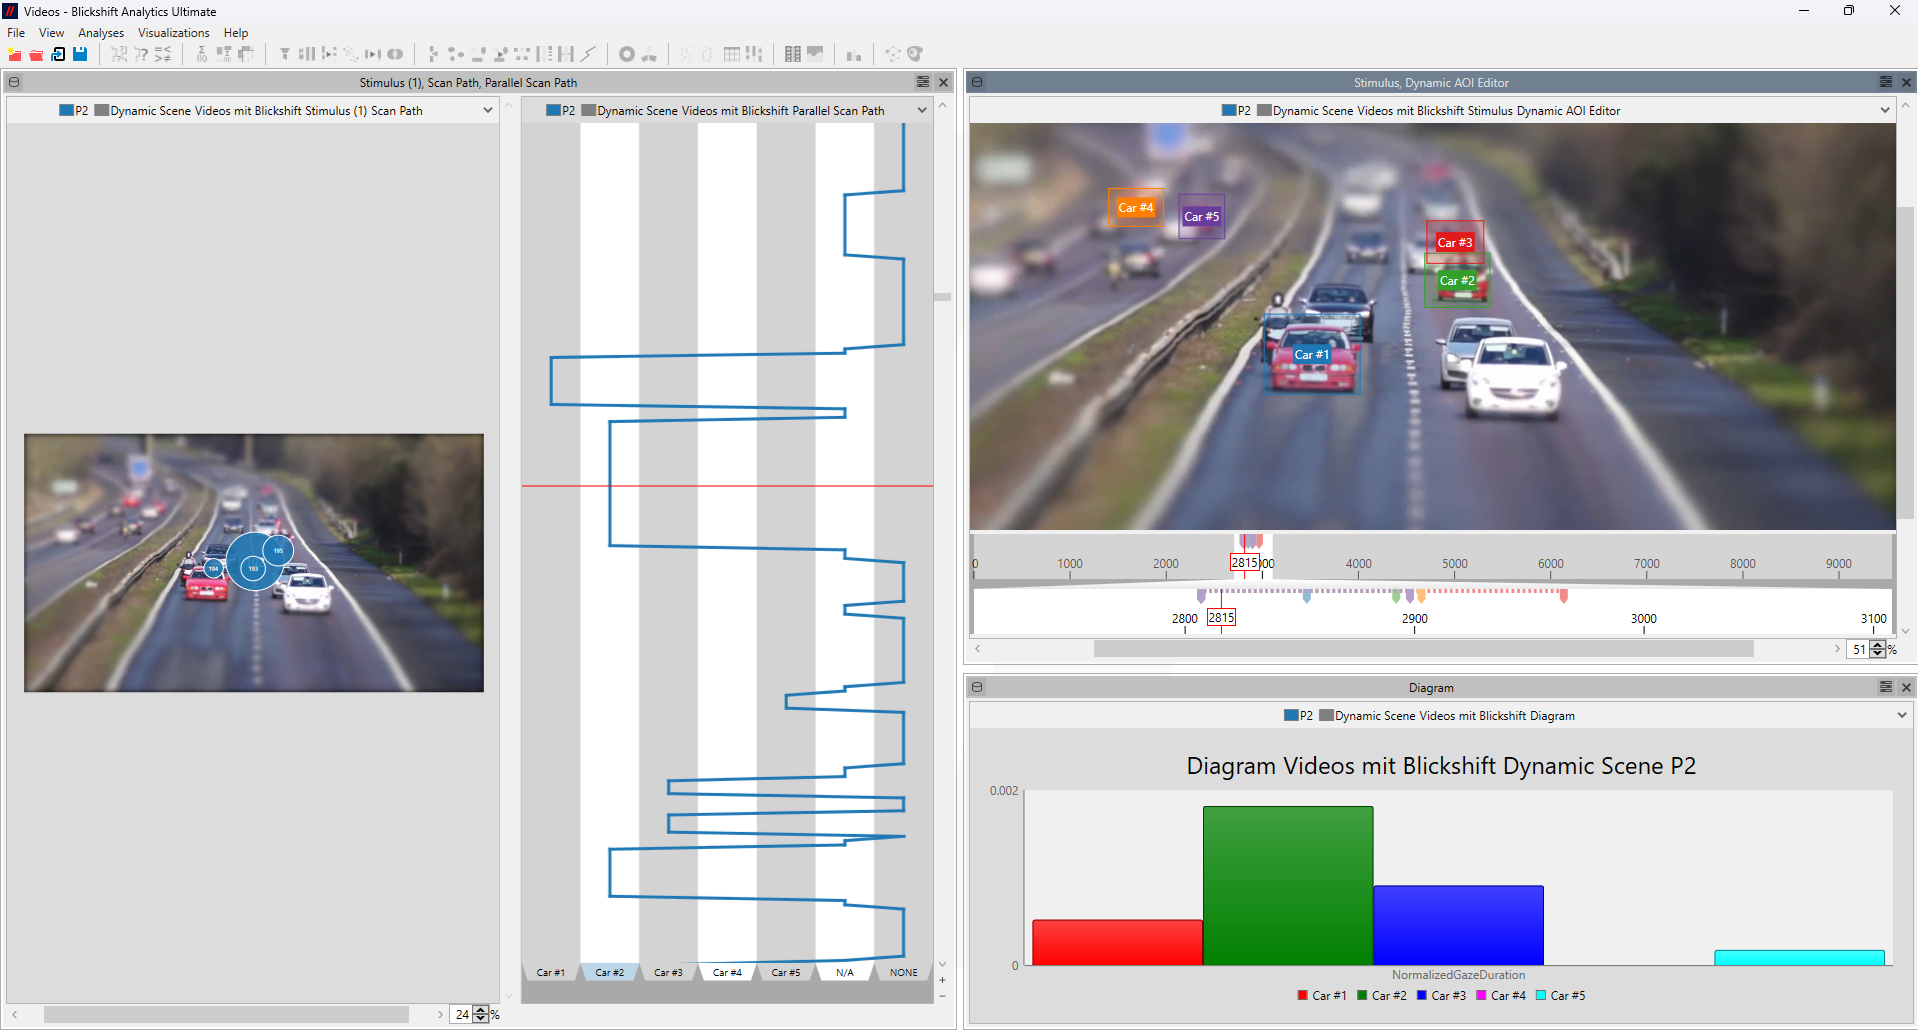
- Blickshift Analytics enables precise AOI tracking even for moving or tiny visual elements. Its intelligent algorithms automatically adapt AOIs to dynamic content, ensuring reliable gaze data at every frame. Researchers can analyze complex visual scenes effortlessly and gain accurate insights into attention and perception, even in the most challenging conditions!
Precise Synchronization of Data Streams
Challenge: Eye, other sensors, and scene data often come from different sources with different timestamps. Misalignment can distort analysis results.
- The software’s flexible timeline view synchronizes multiple data streams (e.g., gaze, scene video, physiological data or motion capture) with millisecond precision. Researchers can easily align events and visualize temporal relationships between signals, ensuring valid and reproducible results.
All important statistics with a single mouse click
Challenge: Calculating statistics metrics about eye movements is an essential tool during an eye tracking analysis.
- We’ve analyzed what metrics most eye tracking researchers are using and have implemented all of them in one single component! With Blickshift Analytics you can now compute up to 21 metrics without any implementation of code just by a mouse-click. Like computing these metrics is easy, you can simply export all these metrics in standard csv format for a further statistical analysis with the tools you are currently already using. If you want to directly visualize the statistical results this is also possible. The statistic node seemlesly works together with our diagram component. Both components are available in all edition of Blickshift Analytics together with the data exporter.


